Accented characters in ggplot
547 views
Skip to first unread message

Crump, Ron
May 6, 2016, 9:38:26 AM5/6/16
to ggp...@googlegroups.com
Hi,
I have data that contains the names of Brazilian states.
Some of these include accented characters, e.g. "Cear\xe1".
This is ok at the level of manipulating the data, but they don't show up
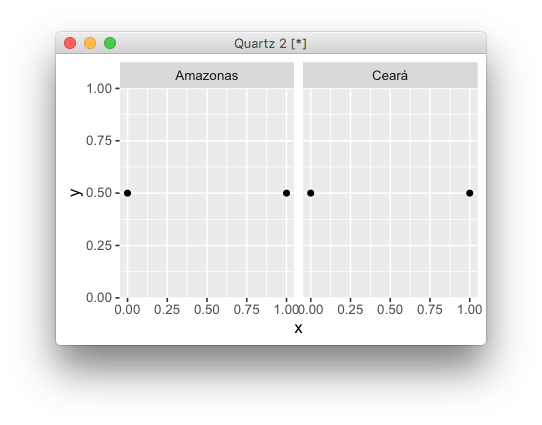
correctly in my ggplot graphs. For example, with facet_grid and the pdf
device "Cear\xe1" was rendered as "Cear.", on the screen (so a quartz
device on MacOSX) the name was dropped altogether. The \xe1 is an acute
accented a.
Here is a tiny example:
DF <- structure(list(state = c("Amazonas", "Amazonas", "Cear\xe1",
"Cear\xe1"), x = c(0, 1, 0, 1), y = c(0.5, 0.5, 0.5, 0.5)), .Names =
c("state",
"x", "y"), row.names = c(NA, -4L), class = "data.frame")
ggplot(DF)+geom_point(aes(x=x,y=y))+facet_wrap(~state)
I have attached a tiff screenshot of the quartz window and a PDF (pdf
device not ggsave). When writing to the pdf device I received 15 warnings
of the type:
In grid.Call(L_textBounds, as.graphicsAnnot(x$label), ... : conversion
failure on 'Cear·' in 'mbcsToSbcs': dot substituted for <e1>
Sys.getlocale() produces:
"en_GB.UTF-8/en_GB.UTF-8/en_GB.UTF-8/C/en_GB.UTF-8/en_GB.UTF-8"
Any suggestions?
While I mention facet_grid, the state names may appear in other graphical
elements too as I go along, e.g. legends, axis labels. Is there a general
solution?
Cheers,
Ron.
I have data that contains the names of Brazilian states.
Some of these include accented characters, e.g. "Cear\xe1".
This is ok at the level of manipulating the data, but they don't show up
correctly in my ggplot graphs. For example, with facet_grid and the pdf
device "Cear\xe1" was rendered as "Cear.", on the screen (so a quartz
device on MacOSX) the name was dropped altogether. The \xe1 is an acute
accented a.
Here is a tiny example:
DF <- structure(list(state = c("Amazonas", "Amazonas", "Cear\xe1",
"Cear\xe1"), x = c(0, 1, 0, 1), y = c(0.5, 0.5, 0.5, 0.5)), .Names =
c("state",
"x", "y"), row.names = c(NA, -4L), class = "data.frame")
ggplot(DF)+geom_point(aes(x=x,y=y))+facet_wrap(~state)
I have attached a tiff screenshot of the quartz window and a PDF (pdf
device not ggsave). When writing to the pdf device I received 15 warnings
of the type:
In grid.Call(L_textBounds, as.graphicsAnnot(x$label), ... : conversion
failure on 'Cear·' in 'mbcsToSbcs': dot substituted for <e1>
Sys.getlocale() produces:
"en_GB.UTF-8/en_GB.UTF-8/en_GB.UTF-8/C/en_GB.UTF-8/en_GB.UTF-8"
Any suggestions?
While I mention facet_grid, the state names may appear in other graphical
elements too as I go along, e.g. legends, axis labels. Is there a general
solution?
Cheers,
Ron.

Brandon Hurr
May 6, 2016, 6:19:50 PM5/6/16
to Crump, Ron, ggp...@googlegroups.com
Ron,
When I leave the labels as you have them, I don't even get a plot.
ggplot(DF)+geom_point(aes(x=x,y=y))+facet_wrap(~state)
Error in UseMethod("depth") :
no applicable method for 'depth' applied to an object of class "NULL"
But, when I type in the á I get a plot and it looks fine. See attachment.
When I leave the labels as you have them, I don't even get a plot.
ggplot(DF)+geom_point(aes(x=x,y=y))+facet_wrap(~state)
Error in UseMethod("depth") :
no applicable method for 'depth' applied to an object of class "NULL"
But, when I type in the á I get a plot and it looks fine. See attachment.
DF <- structure(list(state = c("Amazonas", "Amazonas", "Ceará",
"Ceará"), x = c(0, 1, 0, 1), y = c(0.5, 0.5, 0.5, 0.5)), .Names =
c("state",
"x", "y"), row.names = c(NA, -4L), class = "data.frame")
ggplot(DF)+geom_point(aes(x=x,y=y))+facet_wrap(~state)
HTH,
B
On Fri, May 6, 2016 at 6:38 AM, Crump, Ron <R.E....@warwick.ac.uk> wrote:
> ggplot(DF)+geom_point(aes(x=x,y=y))+facet_wrap(~state)
On Fri, May 6, 2016 at 6:38 AM, Crump, Ron <R.E....@warwick.ac.uk> wrote:
> ggplot(DF)+geom_point(aes(x=x,y=y))+facet_wrap(~state)
Crump, Ron
May 10, 2016, 4:14:38 AM5/10/16
to Brandon Hurr, Crump, Ron, ggp...@googlegroups.com
Brandon,
Thanks for the info. I have swapped out the codes for their accented
characters (e.g. á for \xe1) throughout the data and that has worked well.
Ron.
Thanks for the info. I have swapped out the codes for their accented
characters (e.g. á for \xe1) throughout the data and that has worked well.
Ron.
Reply all
Reply to author
Forward
0 new messages