geom_smooth and logistic regression bands
93 views
Skip to first unread message

Felipe Carrillo
Aug 26, 2015, 6:04:34 PM8/26/15
to ggp...@googlegroups.com
Hello;
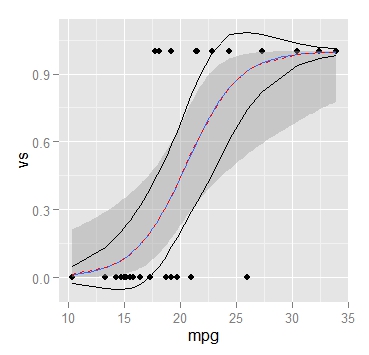
Please consider the code below and the attached figue. I am trying to calculate upper and lower intervals using
glm but for some reason can't match geom_smooth. Any pointers will be appreciated.
data(mtcars)
dat <- subset(mtcars, select=c(mpg, am, vs))
dat
logr_vm <- glm(vs ~ mpg, data=dat, family=binomial)
predd <- cbind(dat,predict(logr_vm,dat,type="response",se.fit=T));head(predd)
library(ggplot2)
ggplot(predd, aes(x=mpg, y=vs)) + geom_point() +
stat_smooth(method="glm", family="binomial") +
geom_line(aes(y=fit),data=predd,colour="red",linetype=2) +
geom_line(aes(y=fit + (1.96*se.fit))) + geom_line(aes(y=fit - (1.96*se.fit)))

Greg Snow
Aug 27, 2015, 9:47:55 AM8/27/15
to Felipe Carrillo, ggp...@googlegroups.com
The standard error and confidence interval should be done on the
linear scale, not the response scale (you can see that your interval
includes values grater than 1 which are impossible).
Try this:
data(mtcars)
dat <- subset(mtcars, select=c(mpg, am, vs))
dat
logr_vm <- glm(vs ~ mpg, data=dat, family=binomial)
predd <- cbind(dat,predict(logr_vm,dat,type="link",se.fit=T));head(predd)
library(ggplot2)
ggplot(predd, aes(x=mpg, y=vs)) + geom_point() +
stat_smooth(method="glm", family="binomial") +
geom_line(aes(y=binomial()$linkinv(fit)),data=predd,colour="red",linetype=2) +
geom_line(aes(y=binomial()$linkinv(fit + (1.96*se.fit)))) +
geom_line(aes(y=binomial()$linkinv(fit - (1.96*se.fit))))
> --
> --
> You received this message because you are subscribed to the ggplot2 mailing
> list.
> Please provide a reproducible example:
> https://github.com/hadley/devtools/wiki/Reproducibility
>
> To post: email ggp...@googlegroups.com
> To unsubscribe: email ggplot2+u...@googlegroups.com
> More options: http://groups.google.com/group/ggplot2
>
> ---
> You received this message because you are subscribed to the Google Groups
> "ggplot2" group.
> To unsubscribe from this group and stop receiving emails from it, send an
> email to ggplot2+u...@googlegroups.com.
> For more options, visit https://groups.google.com/d/optout.
--
Gregory (Greg) L. Snow Ph.D.
538...@gmail.com
linear scale, not the response scale (you can see that your interval
includes values grater than 1 which are impossible).
Try this:
data(mtcars)
dat <- subset(mtcars, select=c(mpg, am, vs))
dat
logr_vm <- glm(vs ~ mpg, data=dat, family=binomial)
library(ggplot2)
ggplot(predd, aes(x=mpg, y=vs)) + geom_point() +
stat_smooth(method="glm", family="binomial") +
geom_line(aes(y=binomial()$linkinv(fit + (1.96*se.fit)))) +
geom_line(aes(y=binomial()$linkinv(fit - (1.96*se.fit))))
> --
> You received this message because you are subscribed to the ggplot2 mailing
> list.
> Please provide a reproducible example:
> https://github.com/hadley/devtools/wiki/Reproducibility
>
> To post: email ggp...@googlegroups.com
> To unsubscribe: email ggplot2+u...@googlegroups.com
> More options: http://groups.google.com/group/ggplot2
>
> ---
> You received this message because you are subscribed to the Google Groups
> "ggplot2" group.
> To unsubscribe from this group and stop receiving emails from it, send an
> email to ggplot2+u...@googlegroups.com.
> For more options, visit https://groups.google.com/d/optout.
--
Gregory (Greg) L. Snow Ph.D.
538...@gmail.com
Reply all
Reply to author
Forward
0 new messages