Scatterplot with shapes by groups, but one regression line for all points, with 19 groups
27 views
Skip to first unread message

Jim Roper
Jun 25, 2017, 10:11:13 AM6/25/17
to ggplot2
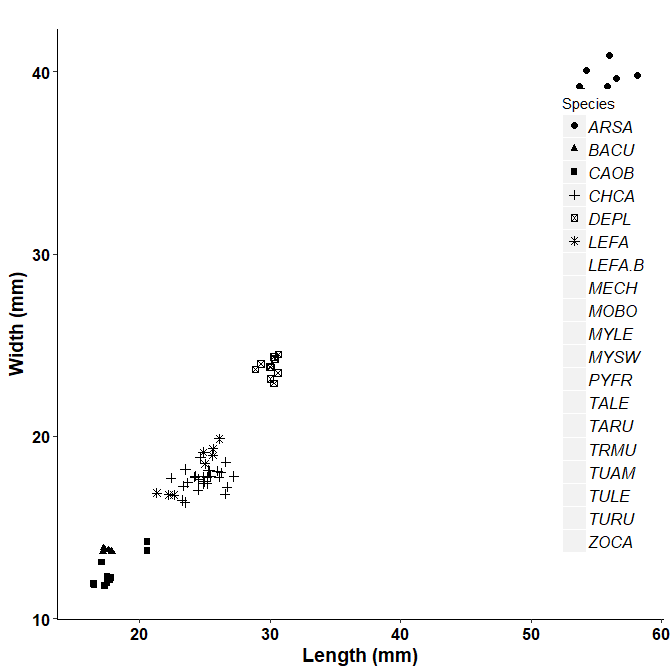
I am trying to make a scatterplot in which groupings show up as symbols, but I want a single regression line to go through all points.
Also, I have 19 groups, and I get the warning that is too many groups (I know it is, but I still need ONE figure with all points). ggplot2 tells me to specify shapes manually, and I think I can figure that out. So, just being able to make one regression line through all points would be great.
In my mind, I imagine two, overlaid, figures - one showing the groupings, the other the line. Is that the strategy? How do I overlay two. See the figure below. Thanks!
Reply all
Reply to author
Forward
0 new messages