Multiple line graphing in R
34 views
Skip to first unread message

Shittu, Aminu
Feb 26, 2015, 11:27:26 PM2/26/15
to ggp...@googlegroups.com
Dear ggplotters,
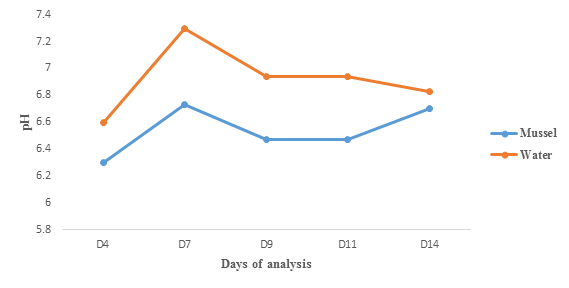
For a beginner practising multiple line plotting in R, using the below few data. Included below the data is the desired graph output, created in Microsoft Excel.
| Days | Mussel(pH) | Water(pH) |
| D4 | 6.3 | 6.6 |
| D7 | 6.73 | 7.3 |
| D9 | 6.47 | 6.94 |
| D11 | 6.47 | 6.94 |
| D14 | 6.7 | 6.83 |
Days (xlab) while pH(ylab).
I expected to have something like below in R.
Please advise.
Aminu

Dennis Murphy
Feb 27, 2015, 1:27:35 AM2/27/15
to Shittu, Aminu, ggp...@googlegroups.com
Hi:
First of all, please learn how to post data to the group. The preferred mode is dput() form, as in
> dput(DF)
structure(list(Day = c(4L, 7L, 9L, 11L, 14L), Mussel = c(6.3,
6.73, 6.47, 6.47, 6.7), Water = c(6.6, 7.3, 6.94, 6.94, 6.83)), .Names = c("Day",
"Mussel", "Water"), class = "data.frame", row.names = c(NA, -5L
))
It makes more sense to use the actual numeric days than factor levels, so I edited your data so that days were numeric (i.e., the D was removed). You then want to melt the data so each variable can be plotted separately, after which you can pass it into ggplot2.
DF <- read.table(header = TRUE, text = "
Day Mussel Water
4 6.3 6.6
7 6.73 7.3
9 6.47 6.94
11 6.47 6.94
14 6.7 6.83")
library(reshape2)
DFm <- melt(DF, id = "Day")
library(ggplot2)
ggplot(DFm, aes(x = Day, y = value, color = variable)) +
theme_bw() +
geom_line(size = 1) + geom_point(size = 2.5) +
labs(x = "Day of analysis", y = "pH", color = "")
--
--
You received this message because you are subscribed to the ggplot2 mailing list.
Please provide a reproducible example: https://github.com/hadley/devtools/wiki/Reproducibility
To post: email ggp...@googlegroups.com
To unsubscribe: email ggplot2+u...@googlegroups.com
More options: http://groups.google.com/group/ggplot2
---
You received this message because you are subscribed to the Google Groups "ggplot2" group.
To unsubscribe from this group and stop receiving emails from it, send an email to ggplot2+u...@googlegroups.com.
For more options, visit https://groups.google.com/d/optout.
Shittu, Aminu
Feb 27, 2015, 9:08:57 AM2/27/15
to Dennis Murphy, ggp...@googlegroups.com
Hi Dennis,
Thank you very much!
Aminu.
Reply all
Reply to author
Forward
0 new messages