Can I modify axis ticks like this?
56 views
Skip to first unread message

石浜裕太郎
Jul 31, 2017, 4:32:20 PM7/31/17
to ggplot2
Hello there,
I am a newbie for ggplot2.
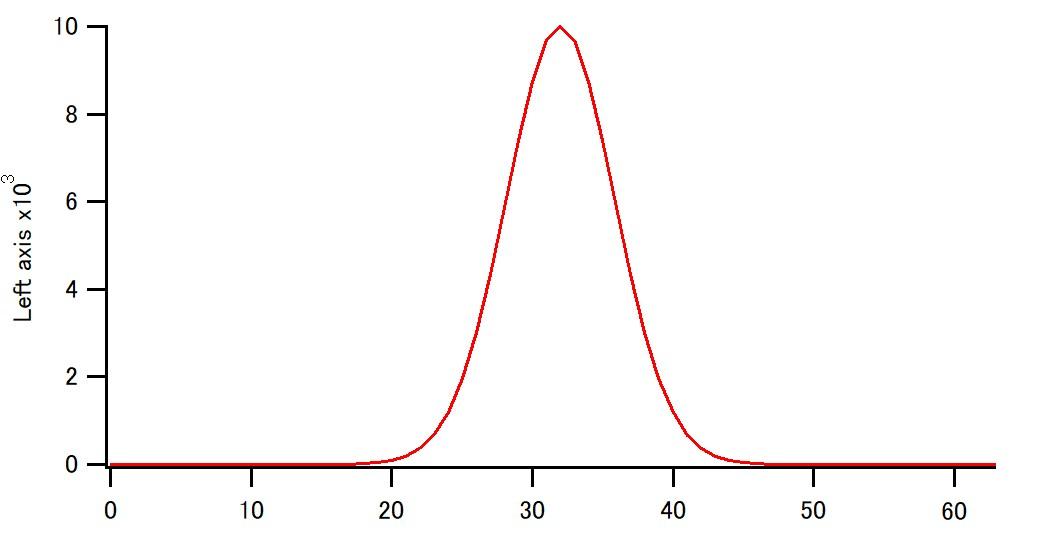
I would like to change axis ticks like the attached jpg (GraphDesired.jpg).
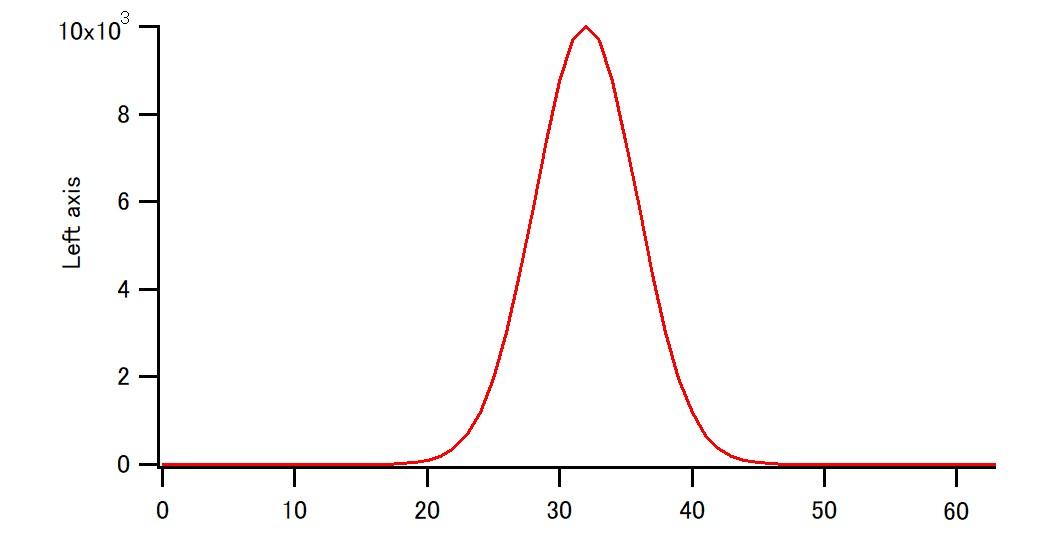
Usually the exponent label is attached to the axis itself (see GraphUndesired.jpg).
I think that the ggplot attaches the exponent label like 10e3 instead of
10 x 10^3 because I rendered these graphs using another application.
My wish is to move this exponent label to the axis label.
It should appear as "Left axis x 10^3"
How can I work it around?
Thanks in advance for your kind help.
Takayuki

Theo Mouton
Jul 31, 2017, 5:34:35 PM7/31/17
to 石浜裕太郎, ggplot2
| Theo Mouton |
| Freshwater Research Assistant |
| +64-7-859-1889 | Gate 10 Silverdale Road, Hillcrest, Hamilton | www.niwa.co.nz |
 |
| To ensure compliance with legal requirements and to maintain cyber security standards, NIWA's IT systems are subject to ongoing monitoring, activity logging and auditing. This monitoring and auditing service may be provided by third parties. Such third parties can access information transmitted to, processed by and stored on NIWA's IT systems. |
--
--
You received this message because you are subscribed to the ggplot2 mailing list.
Please provide a reproducible example: https://github.com/hadley/devtools/wiki/Reproducibility
To post: email ggp...@googlegroups.com
To unsubscribe: email ggplot2+u...@googlegroups.com
More options: http://groups.google.com/group/ggplot2
---
You received this message because you are subscribed to the Google Groups "ggplot2" group.
To unsubscribe from this group and stop receiving emails from it, send an email to ggplot2+u...@googlegroups.com.
For more options, visit https://groups.google.com/d/optout.
石浜裕太郎
Jul 31, 2017, 7:50:30 PM7/31/17
to ggplot2, Theo....@niwa.co.nz
Thanks! But, in my environment, it did not work, First, must it read scale_y_continuous, not scale_x...?
Second, an error message occured:
Error in zero_range(range) : x must be length 1 or 2x1 <- 0:64
gau1 <- 1000000*exp(-1*(x1-32)^2/30)qplot(x1,gau1)+scale......2017年8月1日火曜日 6時34分35秒 UTC+9 Theo Mouton:

Olivia
Aug 7, 2017, 9:56:44 PM8/7/17
to ggplot2, Theo....@niwa.co.nz
the limits in the scale_*() argument are for specifying the ends. The breaks argument allows you to specify the numbers along it. There are a few ways of achieving what you seek to do, here's one (thanks for providing some code). You'll want to make the y axis label more meaningful obviously, but it gives you an idea of how to format it:
x1 <- 0:64
gau1 <- 1000000*exp(-1*(x1-32)^2/30)df <- data.frame(x1, gau1)
ggplot(df, aes(x = x1, y = gau1 * 10^-5)) +
geom_line() +
scale_y_continuous(breaks = seq(from = 0, to = 10, by = 2)) +
labs(y = expression("gau1"~10^5))
You can read more about it in the ggplot2 help pages, most relevant of which are as follows:
Olivia
Reply all
Reply to author
Forward
0 new messages