Error in seq.default(min, max, by = by) :
  'from' cannot be NA, NaN or infinite

oliver.b...@gmail.com
Hi,Error in seq.default(min, max, by = by) :
'from' cannot be NA, NaN or infinite
> length(log10(dat$dispersion)) [1] 190971 > length(na.omit(log10(dat$dispersion))) [1] 190971 > range(log10(dat$count)) [1] -Inf 5.870399 > range(log10(dat$dispersion)) [1] -Inf 12.24184 | |
|
> length(log10(dat$dispersion))
[1] 114714
> length(na.omit(log10(dat$dispersion)))
[1] 114714
> range(log10(dat$count))
[1]     -Inf 5.500933
> range(log10(dat$dispersion))
[1]     -Inf 11.15269

Henrik Bengtsson
On Dec 16, 2014 6:27 AM, <oliver.b...@gmail.com> wrote:
>
> Hi,
>
>
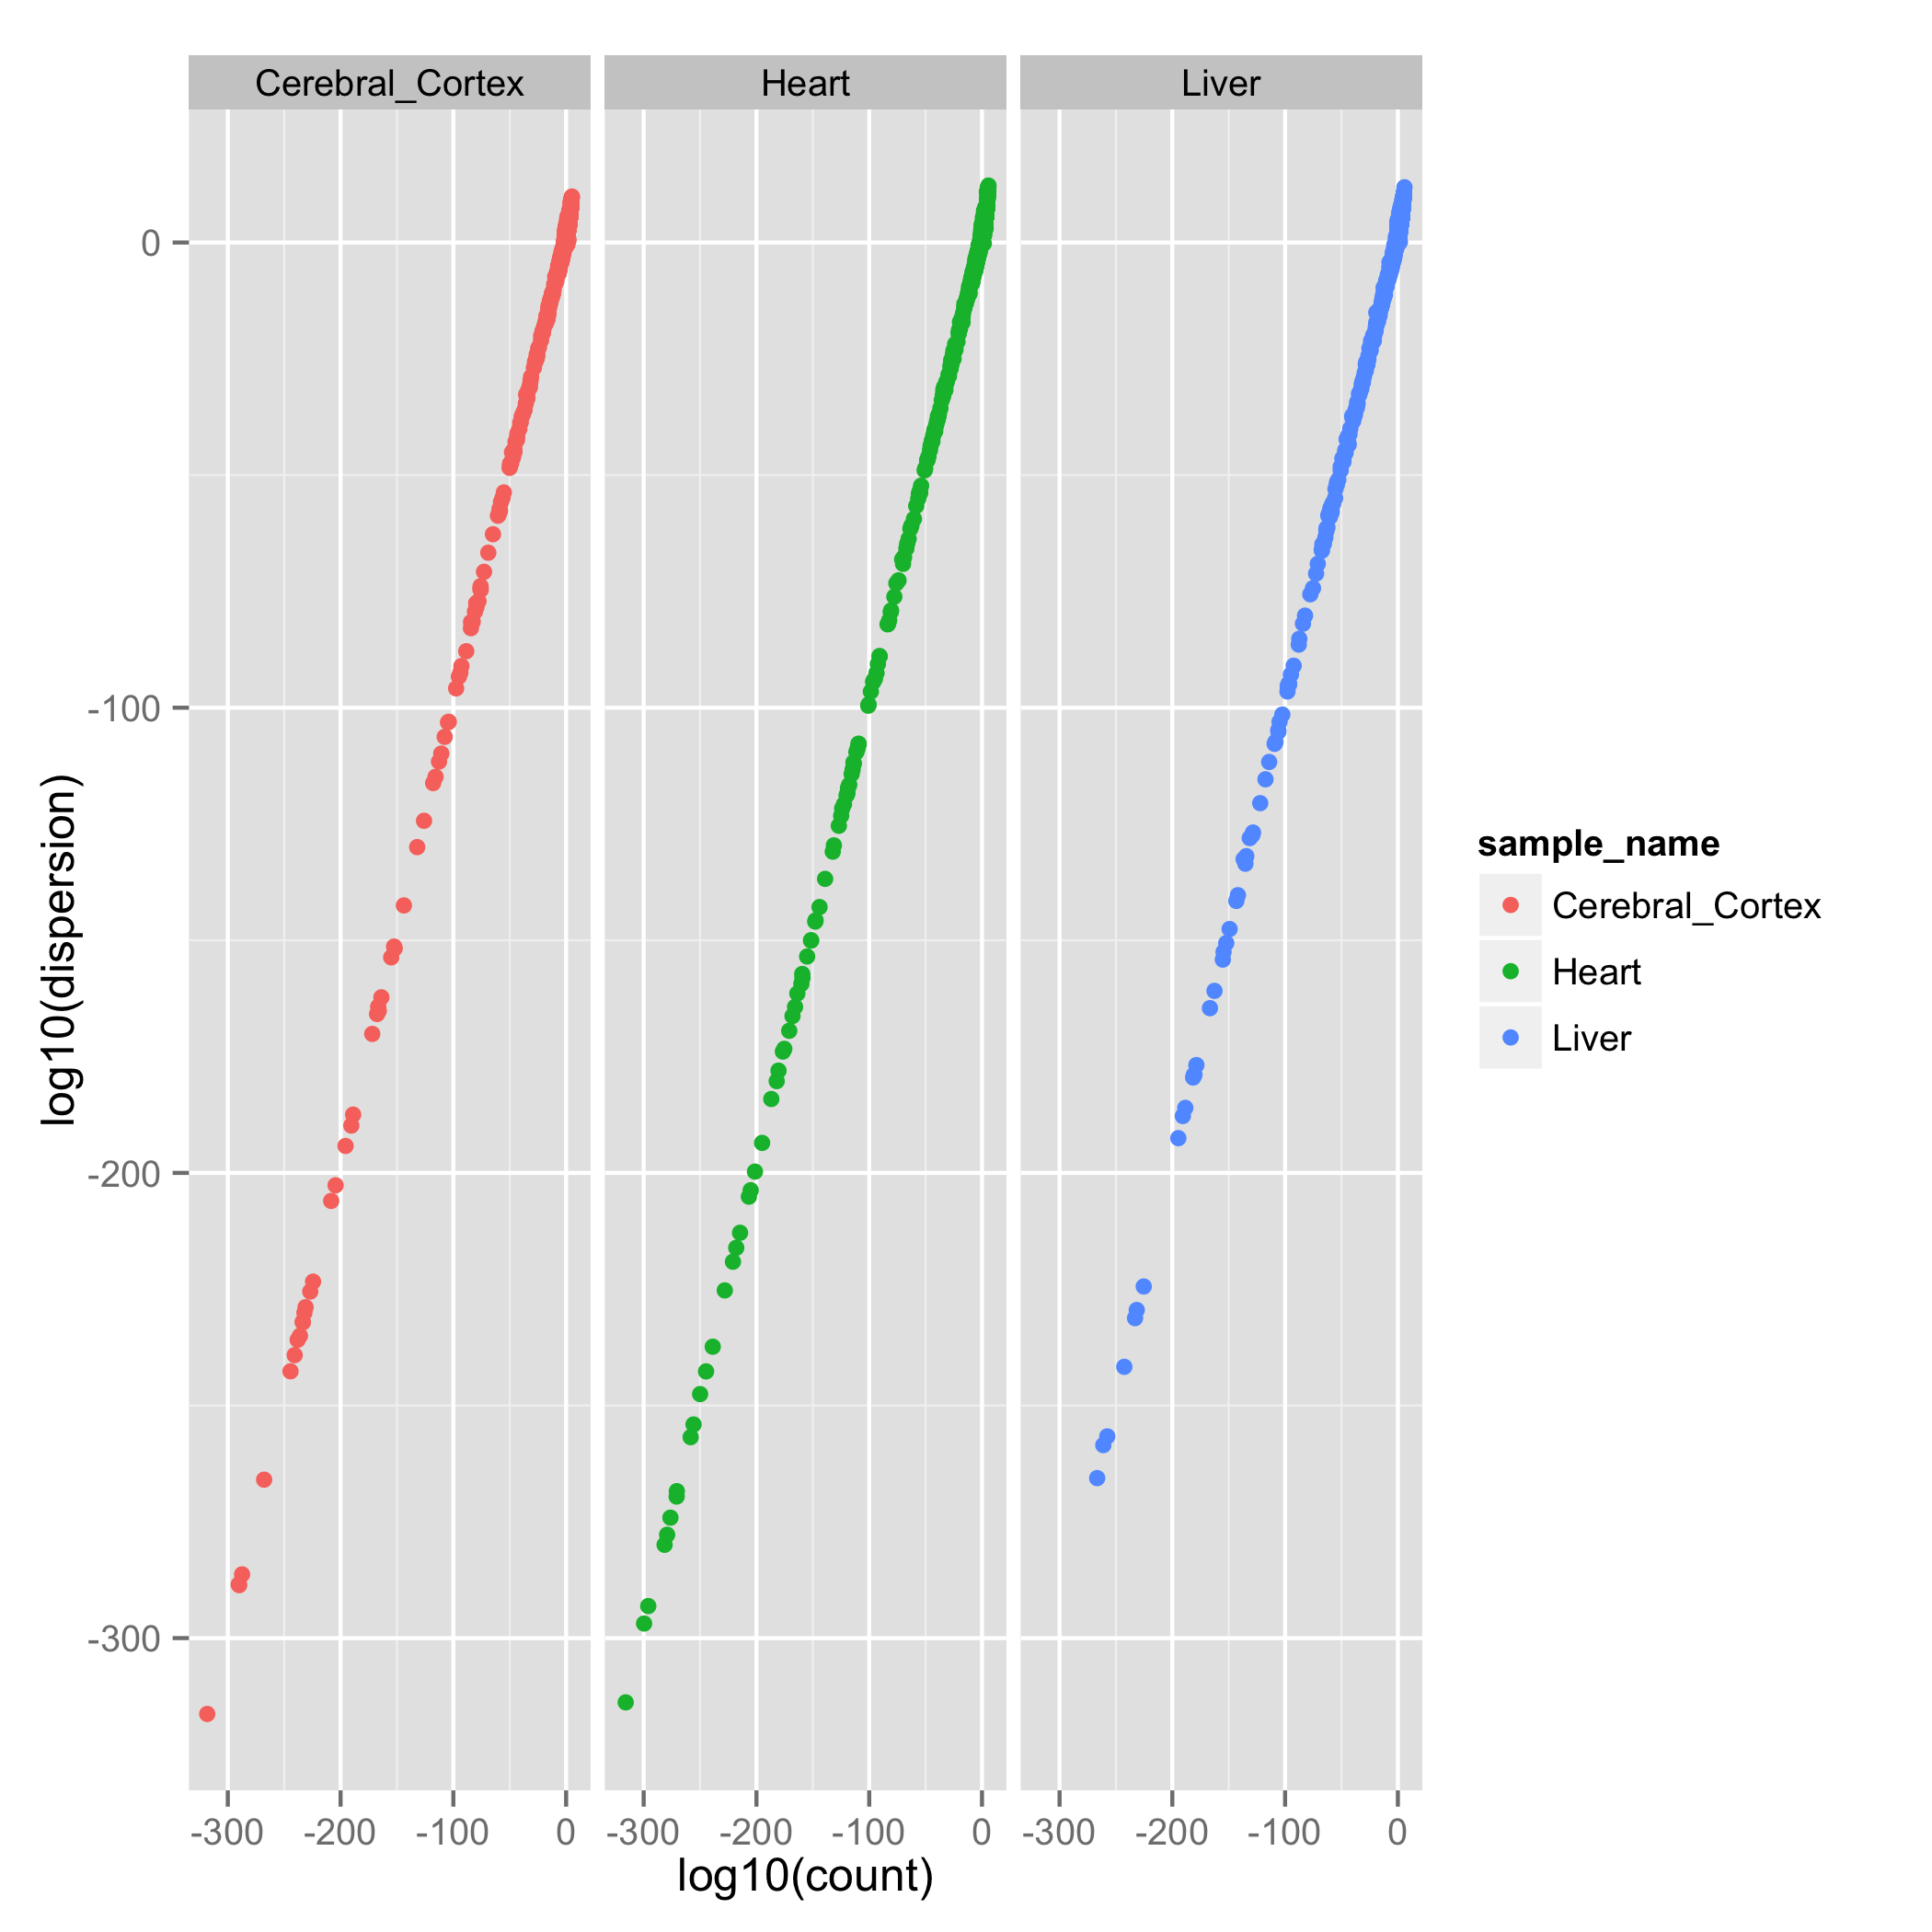
> We are using CummeRbund (ggplot2_1.0.0) and we have rely confusing problem with one of our data set which we tried to visualize
>
> We localized function which throws the error, and this is the functions call:
>
> p<-ggplot(dat)
> p<-p+geom_point(aes(x=count,y=dispersion,color=sample_name)) + facet_wrap('sample_name') + scale_x_log10() + scale_y_log10()
> p
>
> and this is the error:
>
> Error in seq.default(min, max, by = by) :
> 'from' cannot be NA, NaN or infinite
>
>
>
> When we omit scale_x_log10() + scale_y_log10() the call finish without error
Try to keep one of them to see if you can narrow down whether the problem is in the x or y signals or both.
My $0.02
Henrik
> --
> --
> You received this message because you are subscribed to the ggplot2 mailing list.
> Please provide a reproducible example: https://github.com/hadley/devtools/wiki/Reproducibility
>
> To post: email ggp...@googlegroups.com
> To unsubscribe: email ggplot2+u...@googlegroups.com
> More options: http://groups.google.com/group/ggplot2
>
> ---
> You received this message because you are subscribed to the Google Groups "ggplot2" group.
> To unsubscribe from this group and stop receiving emails from it, send an email to ggplot2+u...@googlegroups.com.
> For more options, visit https://groups.google.com/d/optout.
Oliver Bradonjic
Error in seq.default(min, max, by = by) :
'from' cannot be NA, NaN or infiniteError in seq.default(min, max, by = by) :
'from' cannot be NA, NaN or infinite
Brandon Hurr
[1]     -Inf 5.500933
> range(log10(dat$dispersion))
[1]     -Inf 11.15269
oliver.b...@gmail.com
> length(log10(dat$dispersion)) [1] 190971 > length(na.omit(log10(dat$dispersion))) [1] 190971 > range(log10(dat$count)) [1] -Inf 5.870399 > range(log10(dat$dispersion)) [1] -Inf 12.24184 | |
|
> length(log10(dat$dispersion))
[1] 114714
> length(na.omit(log10(dat$dispersion)))
[1] 114714
> range(log10(dat$count))
[1]     -Inf 5.500933
> range(log10(dat$dispersion))
Brandon Hurr