Automatically generate human readable labels (derived from input column names)
25 views
Skip to first unread message

Malte Grosser
Jul 28, 2017, 2:19:08 PM7/28/17
to ggplot2, Daniel Lüdecke
I'd like to format the annotation of ggplot objects automatically via a string manipulation functions.
(If interested: the usecase is more specified here: https://github.com/strengejacke/sjPlot/issues/259)
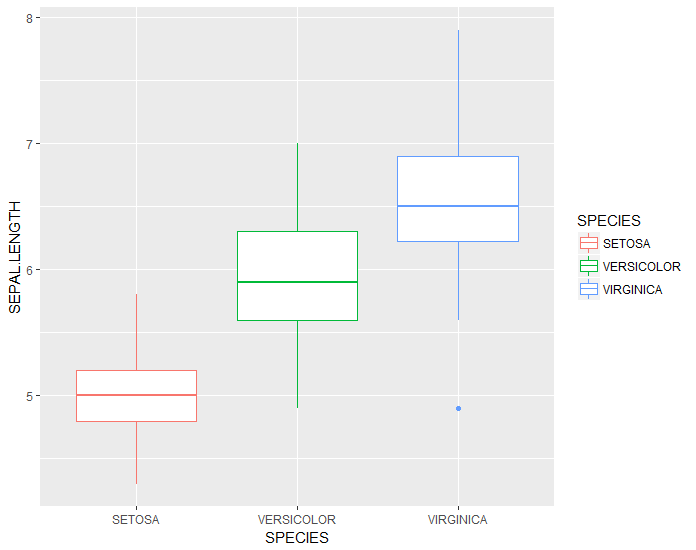
For example I would like to turn the labels (x-axis, y-axis, axis-ticks, legend title and labels, maybe more) of the first ggplot object directly into uppercase, like in the second graphic.

Therefore I would like to find a general way to access the labels of a ggplot object.
For the axis this is easy (object$labels$x and object labels$y). However I don't know how to access the ticks and legend components.
I would really appreciate any help on this.
Thanks,
Malte
(If interested: the usecase is more specified here: https://github.com/strengejacke/sjPlot/issues/259)
For example I would like to turn the labels (x-axis, y-axis, axis-ticks, legend title and labels, maybe more) of the first ggplot object directly into uppercase, like in the second graphic.
Therefore I would like to find a general way to access the labels of a ggplot object.
For the axis this is easy (object$labels$x and object labels$y). However I don't know how to access the ticks and legend components.
I would really appreciate any help on this.
Thanks,
Malte

Hadley Wickham
Jul 28, 2017, 3:21:09 PM7/28/17
to Malte Grosser, ggplot2, Daniel Lüdecke
library(ggplot2)
ggplot(iris, aes(Species, Petal.Length)) +
geom_boxplot(aes(colour = Species)) +
scale_x_discrete(labels = toupper) +
scale_color_discrete(labels = toupper)
Hadley
--
--
You received this message because you are subscribed to the ggplot2 mailing list.
Please provide a reproducible example: https://github.com/hadley/devtools/wiki/Reproducibility
To post: email ggp...@googlegroups.com
To unsubscribe: email ggplot2+unsubscribe@googlegroups.com
More options: http://groups.google.com/group/ggplot2
---
You received this message because you are subscribed to the Google Groups "ggplot2" group.
To unsubscribe from this group and stop receiving emails from it, send an email to ggplot2+unsubscribe@googlegroups.com.
For more options, visit https://groups.google.com/d/optout.

Daniel Lüdecke
Jul 29, 2017, 7:49:48 AM7/29/17
to ggplot2, malte....@googlemail.com, d.lue...@uke.de
I think, the problem is that you have the final plot, created by the user, and need to find out which scales were used (or not). For axis and plot titles, these are directly accessible (via plot$labels$…). But how to find out, if and which scale_… was used, to not overwrite the plot with a wrong or unintended scale?
Best
Daniel
Best
Daniel
On Friday, July 28, 2017 at 9:21:09 PM UTC+2, Hadley Wickham wrote:
library(ggplot2)ggplot(iris, aes(Species, Petal.Length)) +geom_boxplot(aes(colour = Species)) +scale_x_discrete(labels = toupper) +scale_color_discrete(labels = toupper)Hadley
On Fri, Jul 28, 2017 at 11:53 AM, 'Malte Grosser' via ggplot2 <ggp...@googlegroups.com> wrote:
I'd like to format the annotation of ggplot objects automatically via a string manipulation functions.
(If interested: the usecase is more specified here: https://github.com/strengejacke/sjPlot/issues/259)
For example I would like to turn the labels (x-axis, y-axis, axis-ticks, legend title and labels, maybe more) of the first ggplot object directly into uppercase, like in the second graphic.
Therefore I would like to find a general way to access the labels of a ggplot object.
For the axis this is easy (object$labels$x and object labels$y). However I don't know how to access the ticks and legend components.
I would really appreciate any help on this.
Thanks,
Malte
--
--
You received this message because you are subscribed to the ggplot2 mailing list.
Please provide a reproducible example: https://github.com/hadley/devtools/wiki/Reproducibility
To post: email ggp...@googlegroups.com
To unsubscribe: email ggplot2+u...@googlegroups.com
More options: http://groups.google.com/group/ggplot2
---
You received this message because you are subscribed to the Google Groups "ggplot2" group.
To unsubscribe from this group and stop receiving emails from it, send an email to ggplot2+u...@googlegroups.com.
For more options, visit https://groups.google.com/d/optout.
Reply all
Reply to author
Forward
0 new messages