Double legend won't go away
17 views
Skip to first unread message

Alessandra Carioli
May 25, 2016, 7:30:09 AM5/25/16
to ggplot2
Hi,
ggmap( my_map ) +
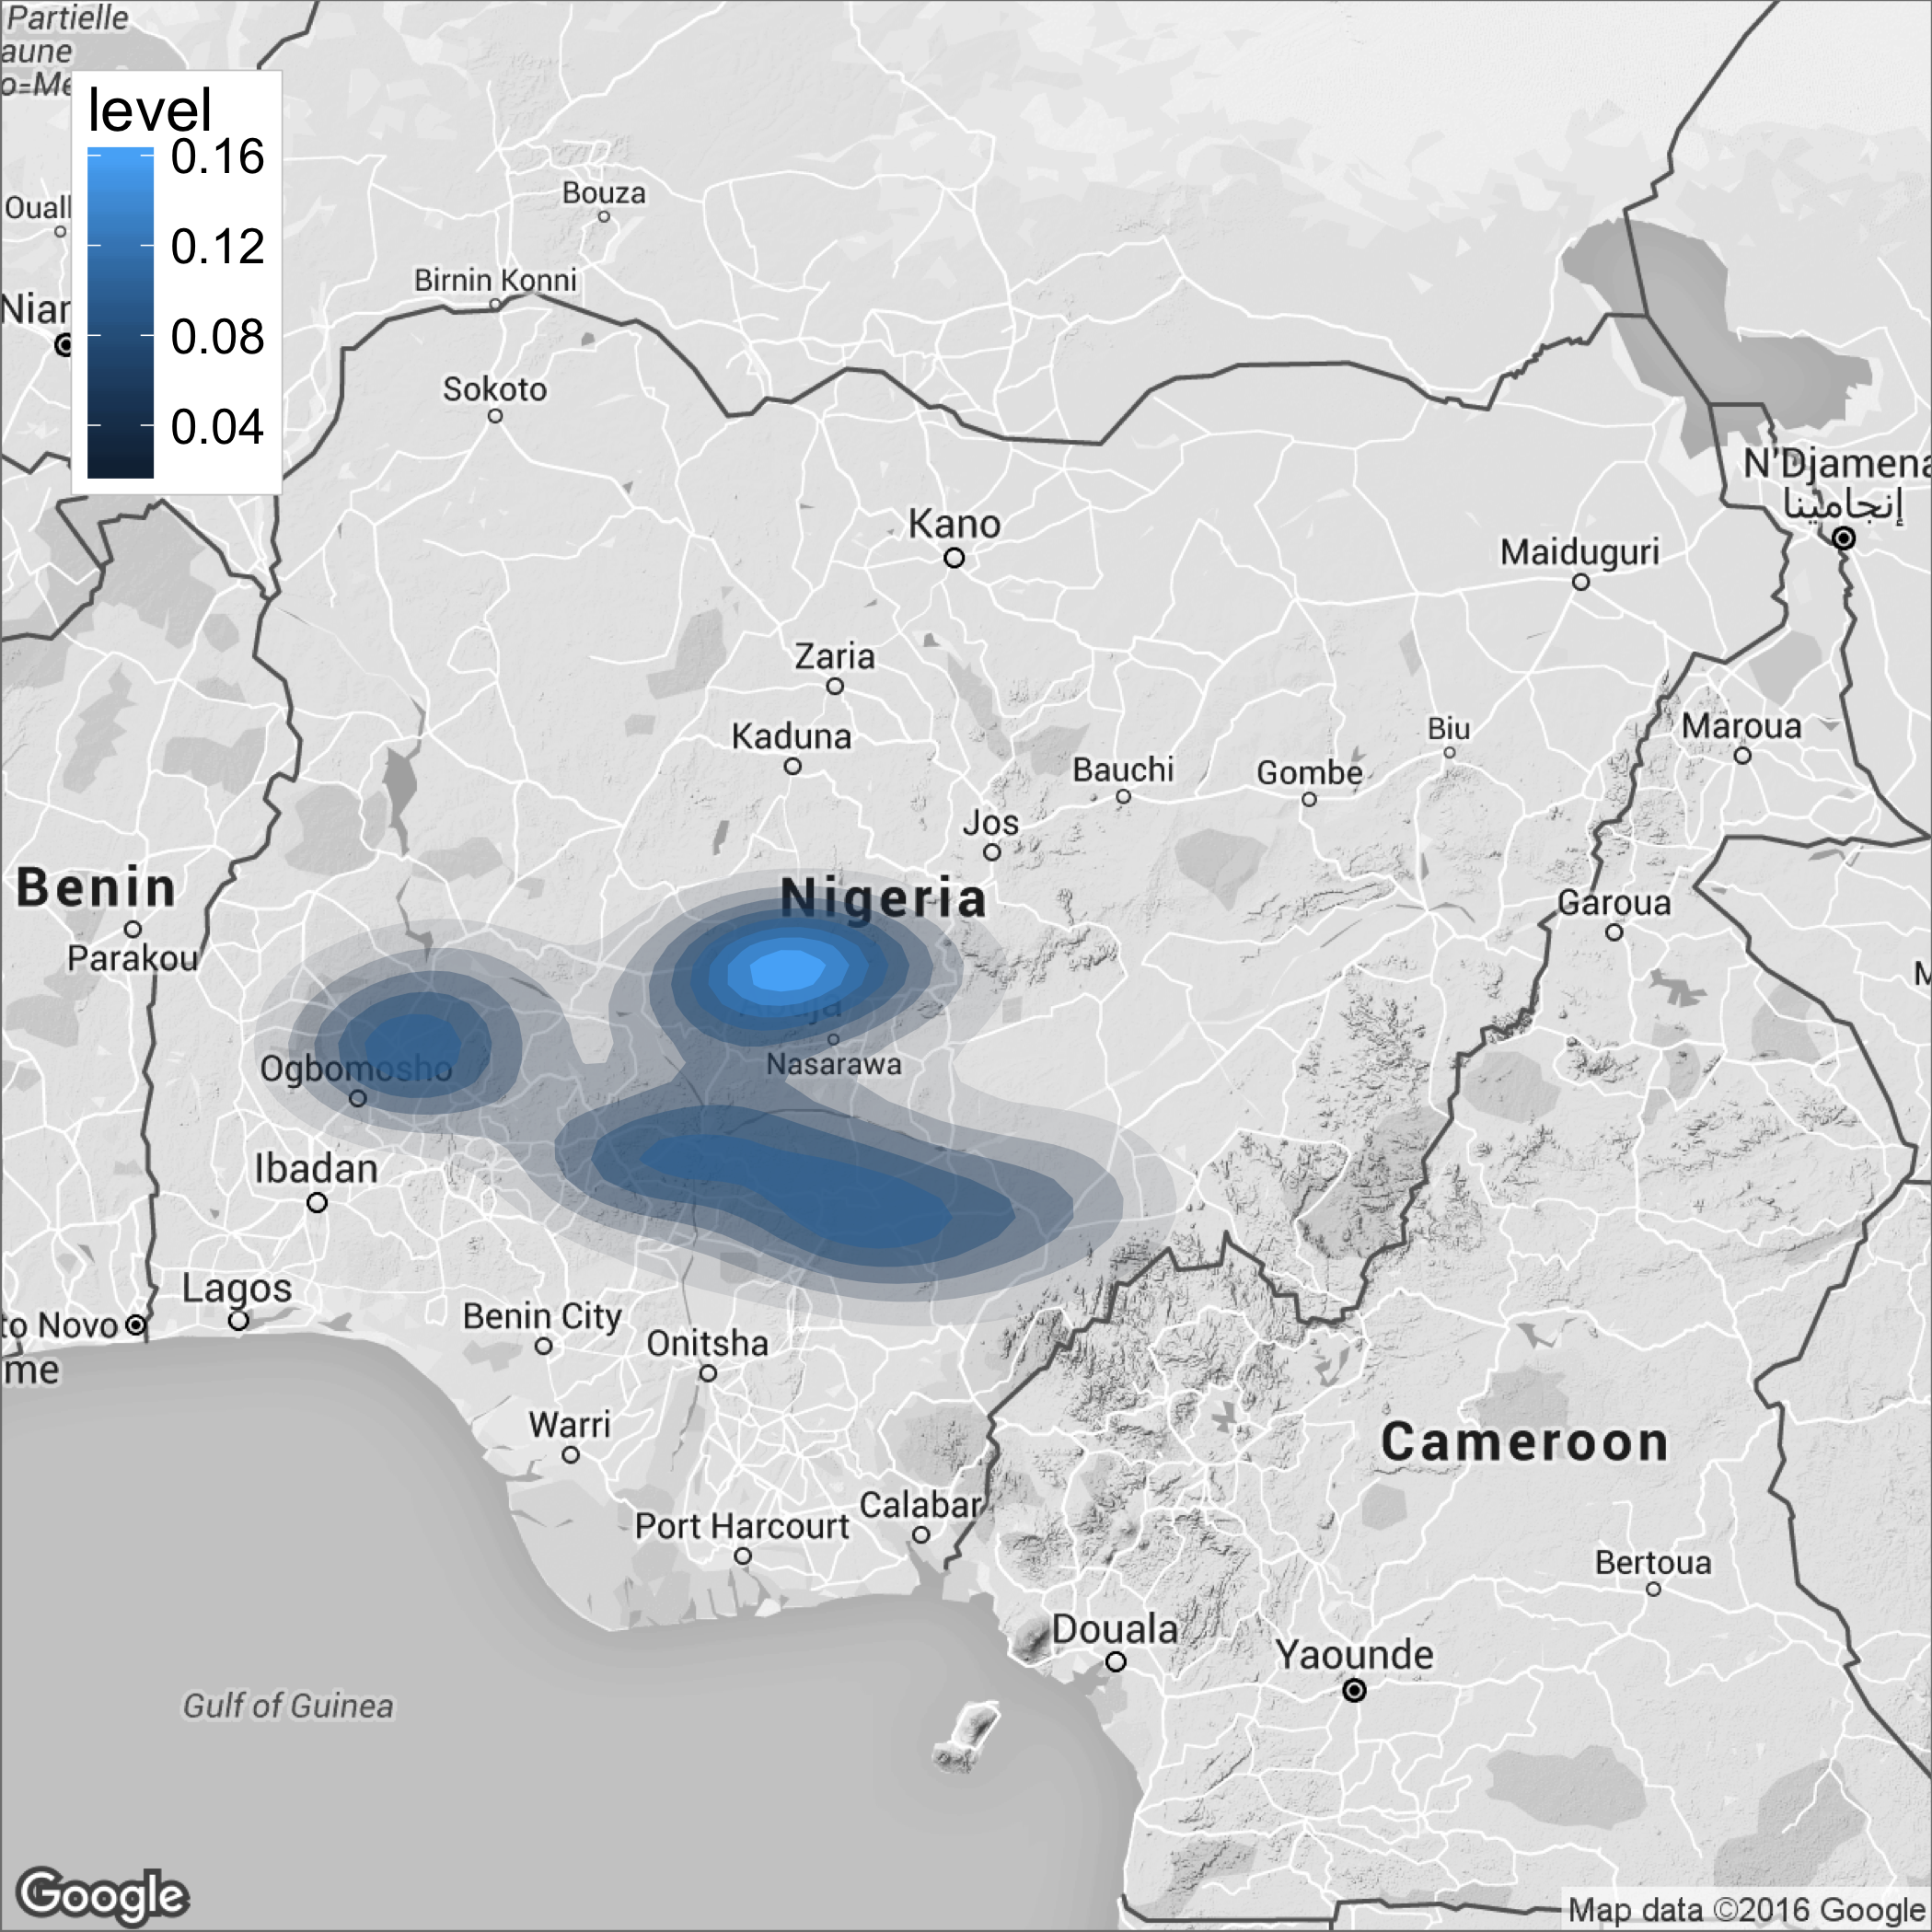
I am using ggmap to plot a map of Nigeria using an example from https://journal.r-project.org/archive/2013-1/kahle-wickham.pdf page 155, which employs stat_density. I keep getting 2 legends a continuous one (for fill I suppose) and a discrete, and I can’t get the latter go away.
Any help on the matter is greatly appreciated,
Ale
ggmap( my_map ) +
stat_density2d( aes( x = coords.x1, y = coords.x2,
fill = ..level.., alpha=..level..),
data = mydata, geom = “polygon”)+
scale_fill_gradient( low = “black”, high = “red”)
mydata=structure(list(coords.x1 = c(8.097115, 7.876807, 7.940457, 9.197081,
9.16421, 8.82081, 9.004712, 8.672722, 8.976706, 8.20877, 9.677511,
9.682045, 8.55256, 8.307408, 7.626355, 8.434496, 7.813354, 7.79639,
8.099183, 7.98704, 8.146332, 9.538207, 9.621146, 9.075205, 6.802451,
6.946514, 7.378751, 7.422396, 7.394607, 7.414277, 7.418711, 7.399262,
7.443314, 7.47703, 7.501654, 7.527573, 7.494066, 7.327502, 7.374716,
7.348256, 6.995731, 7.154071, 7.064911, 7.091917, 7.077051, 7.178458,
6.847795, 6.188577, 6.484442, 7.602561, 7.7566, 7.62176, 7.070504,
7.020374, 6.982528, 7.160336, 6.68264, 6.797413, 5.988825, 5.991781,
6.099531, 6.854475, 6.753847, 6.748363, 6.344131, 6.169152, 6.173435,
6.24953, 7.736047, 7.624369, 7.505779, 4.38855, 4.526147, 3.378472,
3.203993, 5.200414, 4.950153, 4.993176, 4.623362, 4.844875, 5.242049,
4.546441, 4.544727, 4.602338, 4.561175, 4.530087, 4.539439, 4.521048,
5.14145, 4.464231, 4.814712, 4.719409, 4.705347, 5.895578, 8.472936,
8.381281, 8.378301, 8.356697, 7.951489, 7.745062), coords.x2 = c(6.90227,
7.854454, 7.781454, 7.176902, 7.148612, 7.49703, 7.445235, 7.245967,
7.33442, 7.296585, 7.187582, 7.293197, 7.72715, 6.955776, 7.119258,
6.84829, 7.178323, 7.122212, 7.10258, 7.481109, 7.191263, 7.782101,
7.731045, 6.714298, 8.632711, 8.482544, 9.05551, 9.024736, 9.07485,
9.096179, 9.082032, 9.060277, 9.061271, 9.071747, 9.082368, 9.098192,
9.044939, 9.075202, 8.974457, 9.159592, 9.162514, 9.067543, 8.946452,
8.933239, 8.959734, 8.607537, 8.599753, 7.581107, 7.514677, 7.479214,
7.412503, 7.565668, 7.909535, 7.814521, 7.813341, 7.524204, 6.809701,
7.189299, 7.685192, 7.846395, 7.821073, 8.117333, 7.911439, 7.809938,
7.64691, 7.56379, 7.568769, 7.550173, 7.278214, 7.213366, 7.913647,
8.313542, 8.297746, 9.767329, 9.215433, 8.972641, 9.069555, 8.828906,
8.398243, 8.835276, 8.323687, 8.52518, 8.505205, 8.500912, 8.474936,
8.509775, 8.473993, 8.494575, 8.16242, 8.745118, 9.116502, 8.154345,
8.086075, 8.699826, 8.964446, 9.143764, 8.908278, 8.394625, 9.276733,
9.313766), neonatal = c(0.05, 0.03, 0.06, 0.01, 0.01,
0.07229, 0.11111, 0.03125, 0.02, 0.03, 0.01942, 0.02,
0, 0.05128, 0.025, 0.0625, 0, 0, 0, 0.1, 0, 0.11039, 0.01,
0.02797, 0, 0.02778, 0, 0.01, 0, 0, 0.02, 0, 0.05556, 0,
0.05882, 0.03509, 0, 0.1, 0.03333, 0.02, 0.10714, 0.01,
0.0315, 0.025, 0, 0.0396, 0.03529, 0.04, 0, 0.01681, 0.04,
0, 0, 0.02128, 0.0375, 0.02941, 0.03, 0, 0.03125, 0, 0, 0,
0.03571, 0.01653, 0.05882, 0, 0.04, 0.03571, 0, 0, 0, 0.04,
0.08475, 0.01143, 0, 0.0093, 0.02, 0, 0.025, 0.02, 0.07,
0.04918, 0.05556, 0, 0.05128, 0.04, 0.01695, 0.02, 0.07,
0, 0.02941, 0, 0.02198, 0.03478, 0.06, 0.09, 0.04, 0.02,
0.06667, 0.03704)), .Names = c("coords.x1", "coords.x2", "neonatal"
), row.names = c("0", "1", "2", "3", "4", "5", "6", "7", "8",
"9", "10", "11", "12", "13", "14", "15", "16", "17", "18", "19",
"20", "21", "22", "23", "24", "25", "26", "27", "28", "29", "30",
"31", "32", "33", "34", "35", "36", "37", "38", "39", "40", "41",
"42", "43", "44", "45", "46", "47", "48", "49", "50", "51", "52",
"53", "54", "55", "56", "57", "58", "59", "60", "61", "62", "63",
"64", "65", "66", "67", "68", "69", "70", "71", "72", "73", "74",
"75", "76", "77", "78", "79", "80", "81", "82", "83", "84", "85",
"86", "87", "88", "89", "90", "91", "92", "93", "94", "95", "96",
"97", "98", "99"), class = "data.frame")

Brandon Hurr
May 25, 2016, 9:50:55 AM5/25/16
to Alessandra Carioli, ggplot2
Ale,
Thanks for including data, but your example made me do a little too much work to get to the answer :/
my_map <- qmap("nigeria", zoom = 6, color = "bw", legend = "topleft")
my_map +
stat_density2d( aes( x = coords.x1, y = coords.x2, fill = ..level.., alpha = ..level..), geom = "polygon", mydata) +scale_alpha(guide=FALSE) ## this is the part you probably need
That gets rid of the alpha legend.
B
--
--
You received this message because you are subscribed to the ggplot2 mailing list.
Please provide a reproducible example: https://github.com/hadley/devtools/wiki/Reproducibility
To post: email ggp...@googlegroups.com
To unsubscribe: email ggplot2+u...@googlegroups.com
More options: http://groups.google.com/group/ggplot2
---
You received this message because you are subscribed to the Google Groups "ggplot2" group.
To unsubscribe from this group and stop receiving emails from it, send an email to ggplot2+u...@googlegroups.com.
For more options, visit https://groups.google.com/d/optout.
Reply all
Reply to author
Forward
0 new messages