adding text box in legend area
25 views
Skip to first unread message

neuwirthe
Oct 8, 2015, 5:26:49 PM10/8/15
to ggplot2
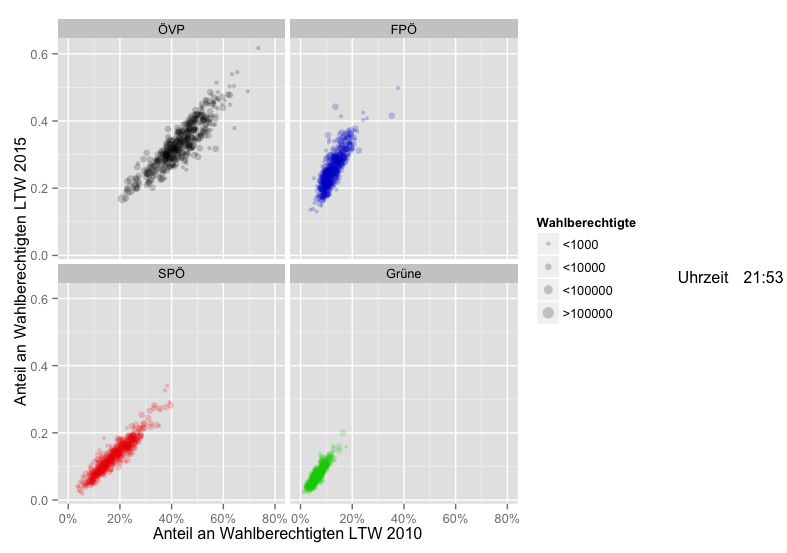
I am creating a faceted plot (image enclosed)
The code is below, but i does not have the data.
I would like to have the text box with "Uhrzeit" above the legend, instead of to the right.
Is there a way of modifying grid.arrange (or another function) which allows overlapping graphics?
I think this would solve my problem.
mytime <- mydf %$% max(zeit)
p <- mydf %>%
  ggplot(aes(x=Anteil_alt,y=Anteil_neu)) +
  geom_point(alpha=0.2,aes(color=Partei,size=size)) +
  scale_color_manual(values=c("black","blue3","red2","green3"),guide="none") +
    scale_size_continuous(
                        name="Wahlberechtigte",
                        limits=c(3,6),range=c(1.5,4),
                        breaks=c(3,4,5,6),
                        labels=c("<1000","<10000","<100000",">100000")) +
  scale_x_continuous(labels=percent,limits=c(0,0.8)) +
  xlab("Anteil an Wahlberechtigten LTW 2010") +
  ylab("Anteil an Wahlberechtigten LTW 2015") +
  facet_wrap(~ Partei,ncol=2)


g <- tableGrob(cbind(c("Uhrzeit"),c(format(mytime,format="%H:%M"))),theme=ttheme_minimal())
grid.arrange(p, g, nrow=1, widths=c(6,1))

Wouter van der Bijl
Oct 9, 2015, 4:12:37 AM10/9/15
to ggplot2
You could use the annotation options in the cowplot package to write on top of your original plot.
W.
Reply all
Reply to author
Forward
0 new messages