panel.border in ggplot2 ploting thicker lines in bottom and right side of the plot
812 views
Skip to first unread message

Geraldo Carvalho Júnior
Apr 16, 2015, 5:26:31 PM4/16/15
to ggp...@googlegroups.com
Does anybody have any idea why this happens?
Following is a reproducible example:
library(sp)
library(ggplot2)
x <- runif(30, 587093, 587152)
y <- runif(30, 7848525, 7848605)
coor <- data.frame(x,y)
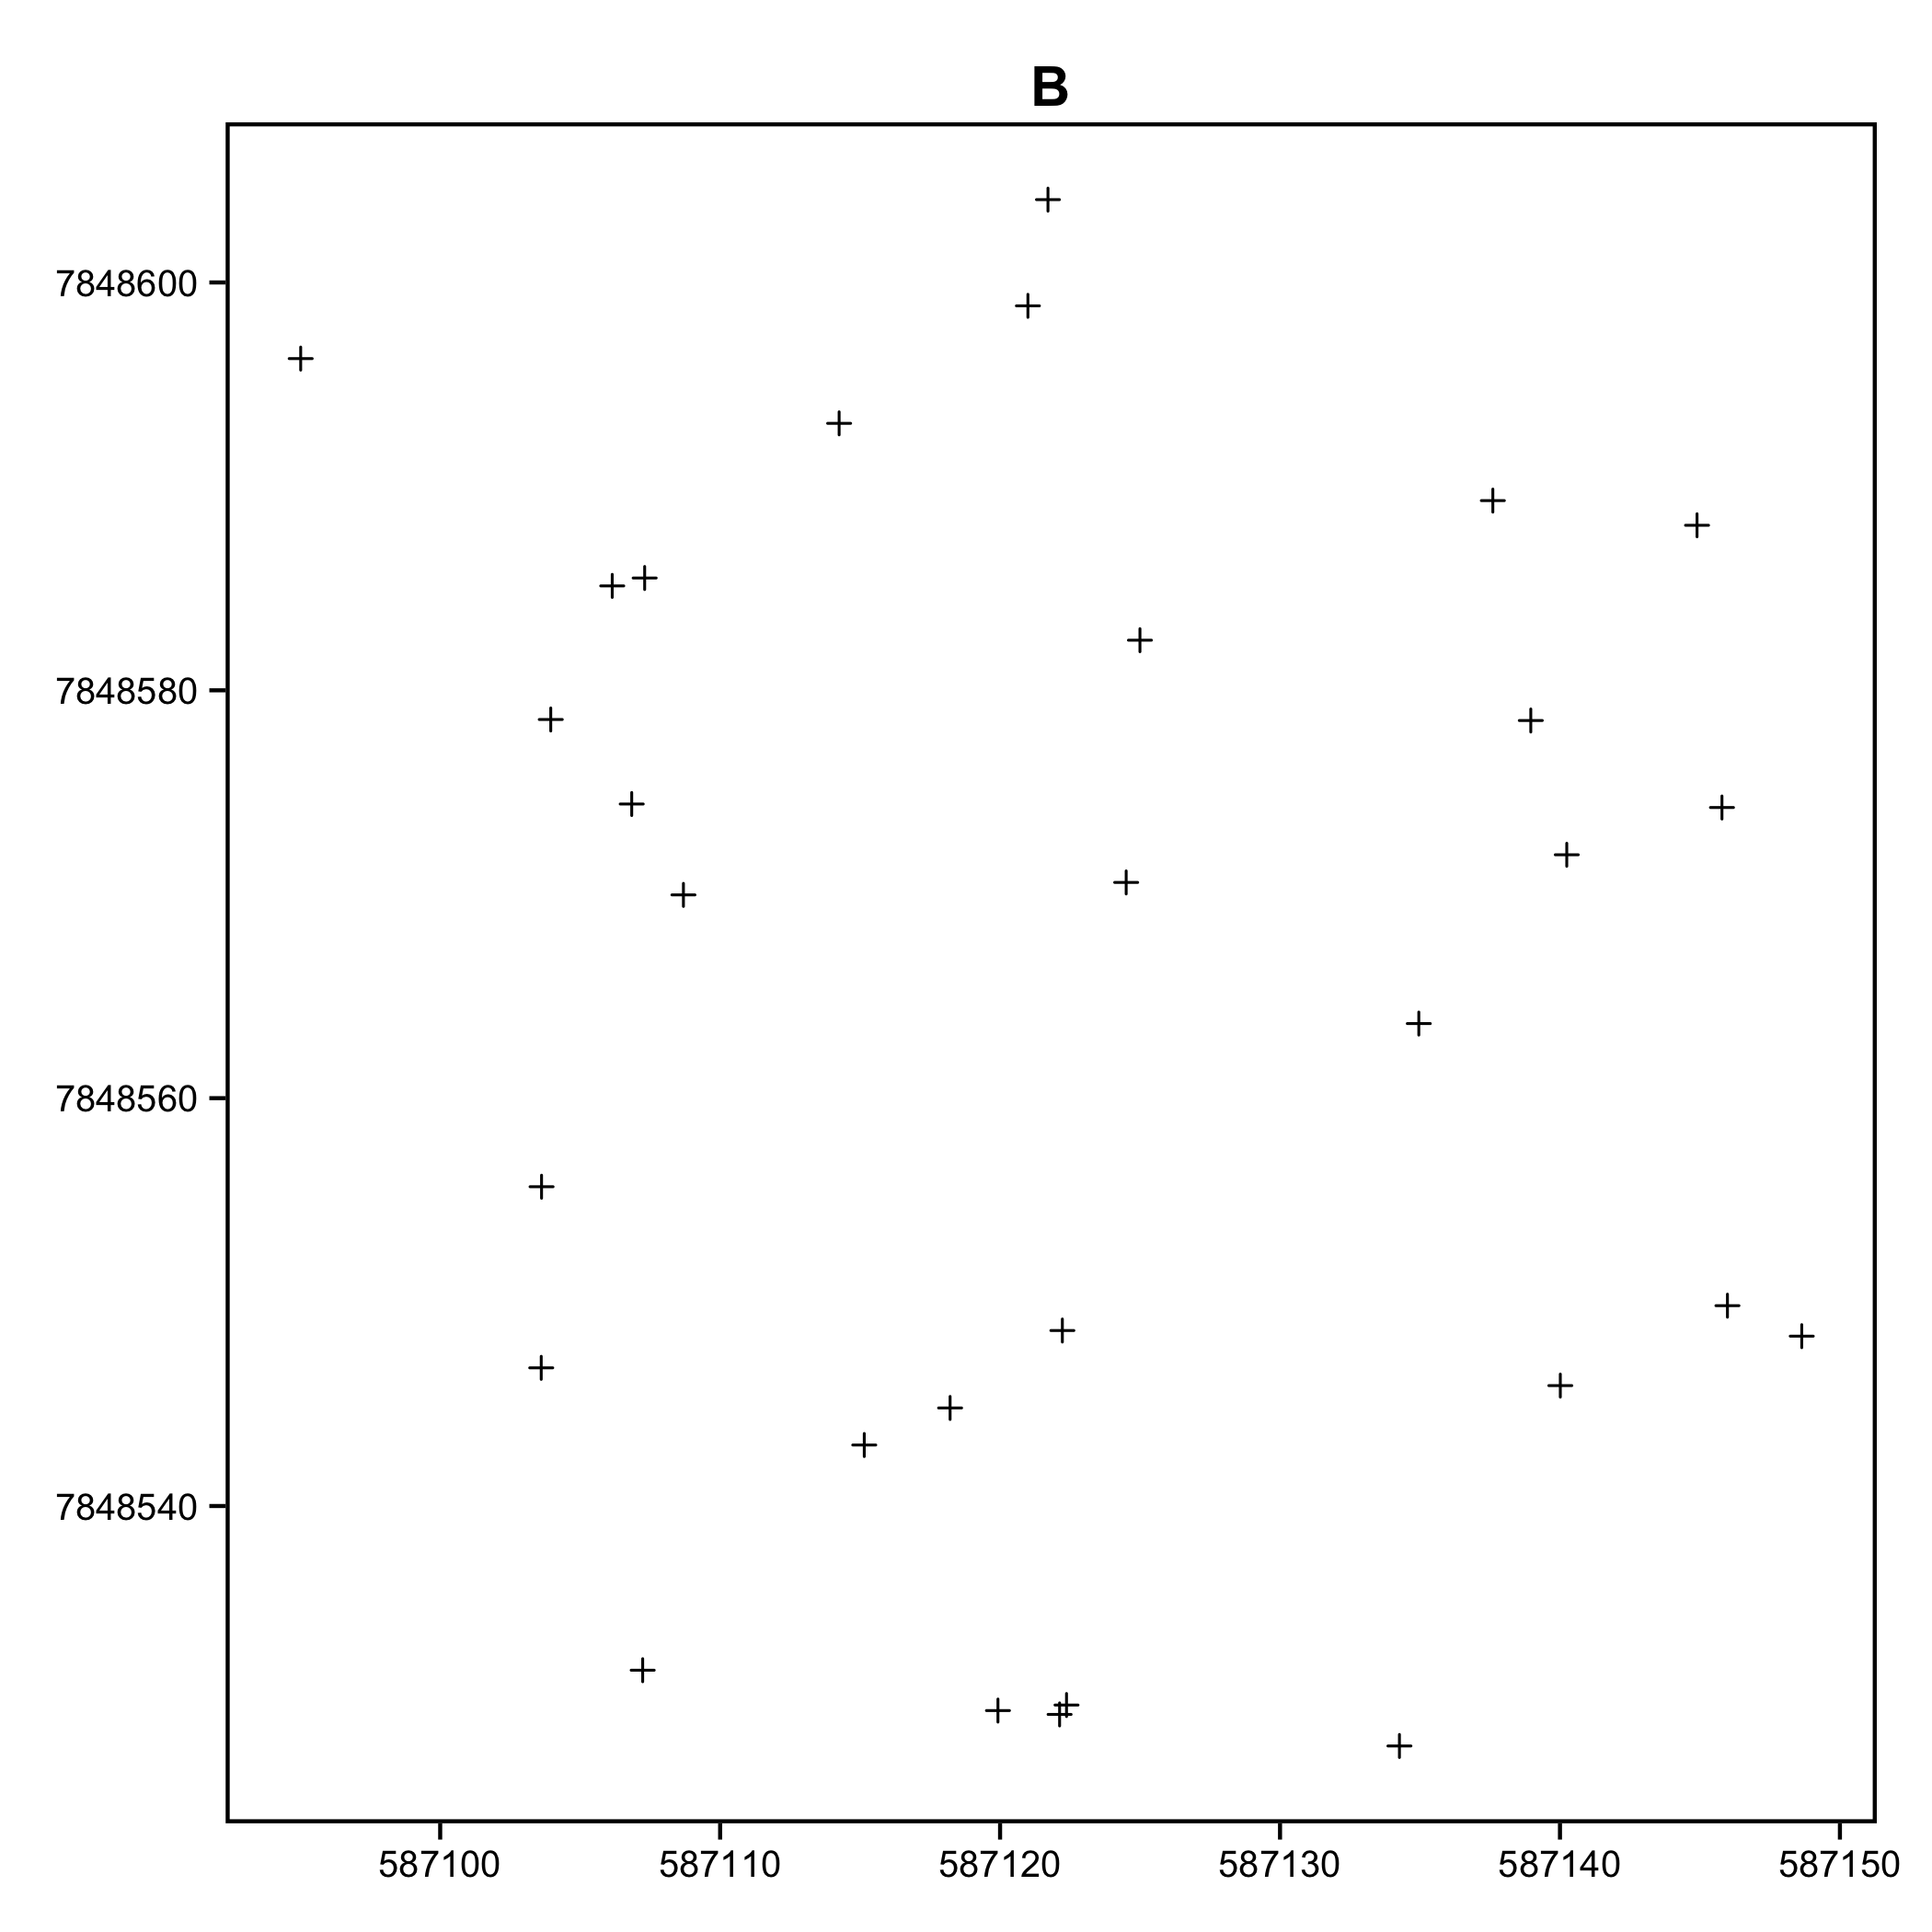
a1 <- ggplot() + geom_point(data=coor, mapping=aes(x=x, y=y), pch=3)
b1 <- a1 + theme_bw() + theme(panel.grid.major = element_blank(), panel.grid.minor = element_blank())
c1 <- b1 + theme(axis.title.y = element_blank()) + theme(axis.title.x = element_blank()) + theme(legend.title=element_blank()) + theme(legend.key= element_rect(colour = "white"))
d1 <- c1 + ggtitle("B") + theme(plot.title = element_text(face="bold", hjust=0.5, vjust=0.6)) + theme(panel.border = element_rect(colour="black", size=1))
d1
Thanks!

Brandon Hurr
Apr 16, 2015, 5:30:41 PM4/16/15
to Geraldo Carvalho Júnior, ggplot2
On Thu, Apr 16, 2015 at 2:26 PM, Geraldo Carvalho Júnior <g.acj...@gmail.com> wrote:
library(sp)library(ggplot2)x <- runif(30, 587093, 587152)y <- runif(30, 7848525, 7848605)coor <- data.frame(x,y)a1 <- ggplot() + geom_point(data=coor, mapping=aes(x=x, y=y), pch=3)b1 <- a1 + theme_bw() + theme(panel.grid.major = element_blank(), panel.grid.minor = element_blank())c1 <- b1 + theme(axis.title.y = element_blank()) + theme(axis.title.x = element_blank()) + theme(legend.title=element_blank()) + theme(legend.key= element_rect(colour = "white"))d1 <- c1 + ggtitle("B") + theme(plot.title = element_text(face="bold", hjust=0.5, vjust=0.6)) + theme(panel.border = element_rect(colour="black", size=1))d1
Could you attach a photo? I don't see anything wrong on my end.
> sessionInfo()
R version 3.1.3 (2015-03-09)
Platform: x86_64-apple-darwin13.4.0 (64-bit)
Running under: OS X 10.10.3 (Yosemite)
locale:
[1] en_US.UTF-8/en_US.UTF-8/en_US.UTF-8/C/en_US.UTF-8/en_US.UTF-8
attached base packages:
[1] stats graphics grDevices utils datasets methods base
other attached packages:
[1] ggplot2_1.0.1 sp_1.0-17
loaded via a namespace (and not attached):
[1] colorspace_1.2-6 digest_0.6.8 grid_3.1.3 gtable_0.1.2 labeling_0.3
[6] lattice_0.20-30 MASS_7.3-40 munsell_0.4.2 plyr_1.8.1 proto_0.3-10
[11] Rcpp_0.11.5 reshape2_1.4.1 scales_0.2.4 stringr_0.6.2

tric...@uni-bremen.de
Apr 16, 2015, 5:37:43 PM4/16/15
to ggp...@googlegroups.com
I uploaded a picture here:
http://s7.postimg.org/52q38soq3/Rplot01.png
Apparently, this behaviour stops when in theme(panel.border =
element_rect(colour="black",
>> size=1)) size is set to anything else than "1".
Zitat von Brandon Hurr <brando...@gmail.com>:
> --
> --
> You received this message because you are subscribed to the ggplot2
> mailing list.
> Please provide a reproducible example:
> https://github.com/hadley/devtools/wiki/Reproducibility
>
> To post: email ggp...@googlegroups.com
> To unsubscribe: email ggplot2+u...@googlegroups.com
> More options: http://groups.google.com/group/ggplot2
>
> ---
> You received this message because you are subscribed to the Google
> Groups "ggplot2" group.
> To unsubscribe from this group and stop receiving emails from it,
> send an email to ggplot2+u...@googlegroups.com.
> For more options, visit https://groups.google.com/d/optout.
http://s7.postimg.org/52q38soq3/Rplot01.png
Apparently, this behaviour stops when in theme(panel.border =
element_rect(colour="black",
>> size=1)) size is set to anything else than "1".
Zitat von Brandon Hurr <brando...@gmail.com>:
> --
> You received this message because you are subscribed to the ggplot2
> mailing list.
> Please provide a reproducible example:
> https://github.com/hadley/devtools/wiki/Reproducibility
>
> To post: email ggp...@googlegroups.com
> To unsubscribe: email ggplot2+u...@googlegroups.com
> More options: http://groups.google.com/group/ggplot2
>
> ---
> You received this message because you are subscribed to the Google
> Groups "ggplot2" group.
> To unsubscribe from this group and stop receiving emails from it,
> send an email to ggplot2+u...@googlegroups.com.
> For more options, visit https://groups.google.com/d/optout.
0 new messages