Error with geom_text
749 views
Skip to first unread message

Manuel Spínola
Aug 19, 2016, 9:45:23 AM8/19/16
to ggplot2
Dear group members,
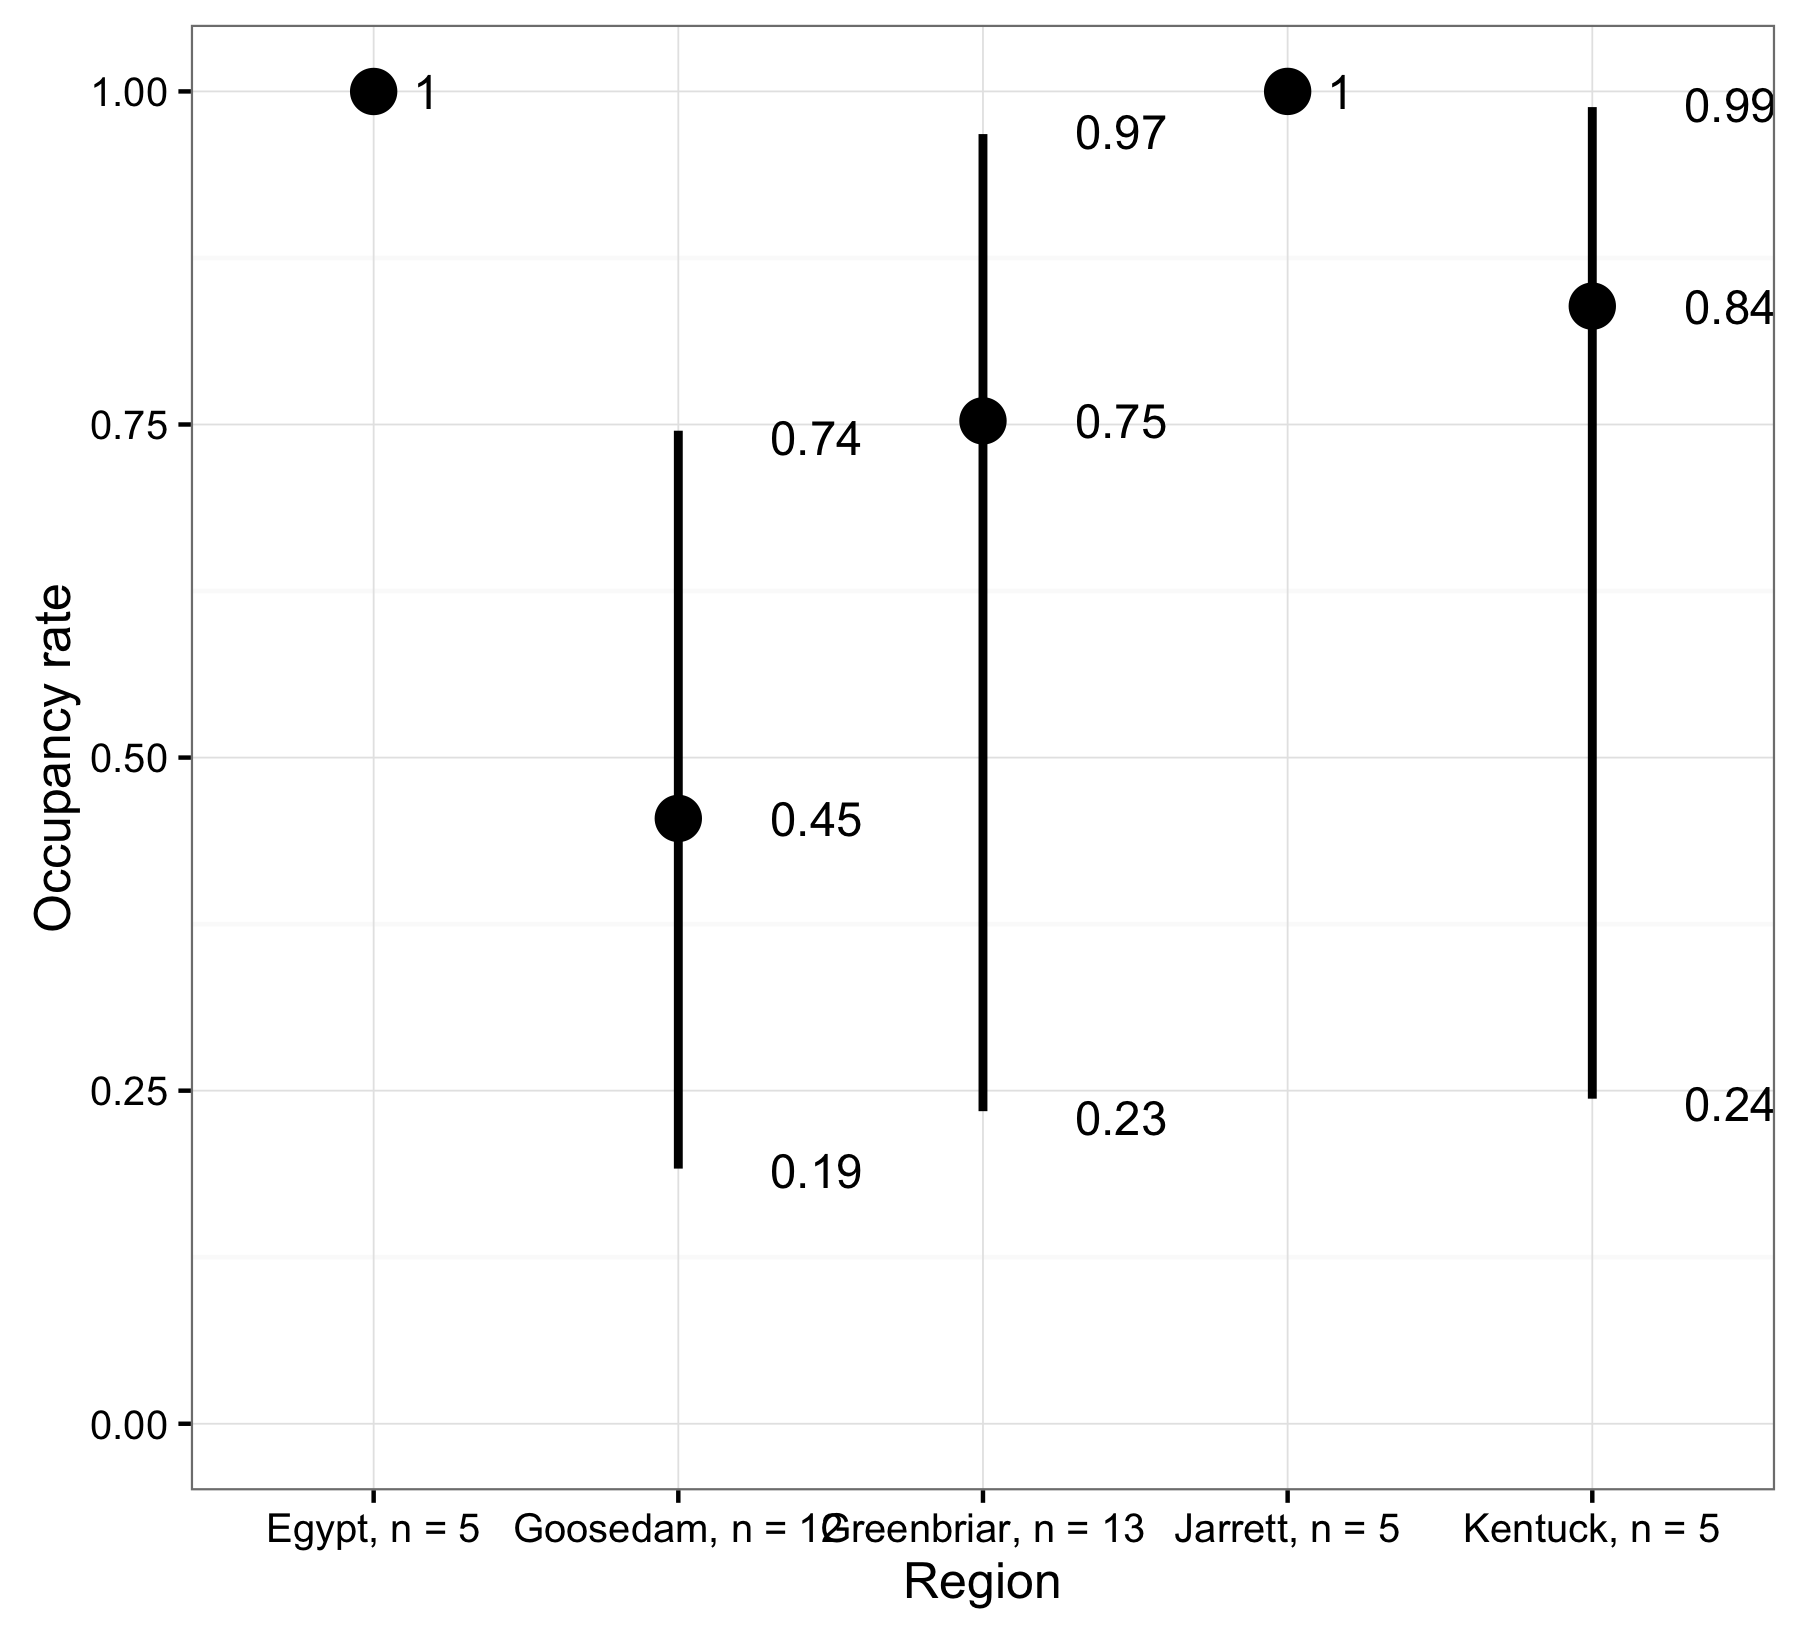
I am trying to label point estimates, lower and upper confidence limits in geom_pointrange but I got an error. The problem is with the 2 last geom_text in my code. I am trying to label some of the geom_pointrange not all.
My data:
> dput(pre_state_t12)
structure(list(Predicted = c(0.99994215562491, 0.454329193369023,
0.752714580480749, 0.999999712432362, 0.838845441403382), SE = c(0.00340145832186754,
0.159007108659988, 0.21801168405403, 0.00024122920915448, 0.19178485914968
), lower = c(1, 0.19150278825303, 0.234608027335444, 1, 0.243988915572354
), upper = c(1, 0.745335445352278, 0.967977117718246, 1, 0.98822880016548
), site.name = structure(1:5, .Label = c("Egypt, n = 5", "Goosedam, n = 12",
"Greenbriar, n = 13", "Jarrett, n = 5", "Kentuck, n = 5"), class = "factor")), .Names = c("Predicted",
"SE", "lower", "upper", "site.name"), row.names = c(NA, 5L), class = "data.frame")
My code and error
> p = ggplot(pre_state_t12, aes(site.name, Predicted))
> p2012_state = p + geom_pointrange(aes(ymin = lower, ymax = upper), size = 1, stat = "identity") + theme_bw() + ylim(c(0,1)) + xlab("Region") + ylab("Occupancy rate") +
+ geom_text(aes(label = round(Predicted, 2)), hjust = c(-1.5, -1, -1, -1.5, -1), size = 4) +
+ geom_text(aes(label = c(0.19, 0.23, 0.24), x = c(2, 3, 5), y = c(0.19, 0.23, 0.24)), hjust = -1, size = 4) +
+ geom_text(aes(label = c(0.74, 0.97, 0.99), x = c(2, 3, 5), y = c(0.74, 0.97, 0.99)), hjust = -1, size = 4)
>
> p2012_state
Error: Aesthetics must be either length 1 or the same as the data (5): x, y, label
Manuel Spínola, Ph.D.
Instituto Internacional en Conservación y Manejo de Vida Silvestre
Universidad Nacional
Apartado 1350-3000
Heredia
COSTA RICA
mspi...@una.cr
mspin...@gmail.com
Teléfono: (506) 8706 - 4662
Personal website: Lobito de río
Institutional website: ICOMVIS
Instituto Internacional en Conservación y Manejo de Vida Silvestre
Universidad Nacional
Apartado 1350-3000
Heredia
COSTA RICA
mspi...@una.cr
mspin...@gmail.com
Teléfono: (506) 8706 - 4662
Personal website: Lobito de río
Institutional website: ICOMVIS

Brandon Hurr
Aug 19, 2016, 11:33:25 AM8/19/16
to Manuel Spínola, ggplot2
On Fri, Aug 19, 2016 at 6:45 AM, Manuel Spínola <mspin...@gmail.com> wrote:
geom_pointrange(aes(ymin = lower, ymax = upper), size = 1, stat = "identity") + theme_bw() + ylim(c(0,1)) + xlab("Region") + ylab("Occupancy rate") ++ geom_text(aes(label = round(Predicted, 2)), hjust = c(-1.5, -1, -1, -1.5, -1), size = 4) ++ geom_text(aes(label = c(0.19, 0.23, 0.24), x = c(2, 3, 5), y = c(0.19, 0.23, 0.24)), hjust = -1, size = 4) ++ geom_text(aes(label = c(0.74, 0.97, 0.99), x = c(2, 3, 5), y = c(0.74, 0.97, 0.99)), hjust = -1, size = 4)
Manuel,
I believe it's because ggplot2 expects things in a dataframe.
lab1 <- data.frame(x = c(2, 3, 5), y = c(0.19, 0.23, 0.24))
lab2 <- data.frame(x = c(2, 3, 5), y = c(0.74, 0.97, 0.99))
ggplot(pre_state_t12, aes(site.name, Predicted)) + geom_pointrange(aes(ymin = lower, ymax = upper), size = 1, stat = "identity") + theme_bw() + ylim(c(0,1)) + xlab("Region") + ylab("Occupancy rate") +
geom_text(aes(label = round(Predicted, 2)), hjust = c(-1.5, -1, -1, -1.5, -1), size = 4) +
geom_text(data = lab1, aes(label = y, x = x, y = y), hjust = -1, size = 4) +
geom_text(data = lab2, aes(label = y, x = x, y = y), hjust = -1, size = 4)
Does that look right?
B

William Murphy
Aug 19, 2016, 12:04:13 PM8/19/16
to ggplot2
Manuel,
The simplest way to manually add a few values to the plot is with the annotate function instead of geom_text:
ggplot(pre_state_t12, aes(site.name, Predicted)) +
geom_pointrange(aes(ymin = lower, ymax = upper), size = 1, stat = "identity") + theme_bw() + ylim(c(0,1)) + xlab("Region") + ylab("Occupancy rate") +
geom_text(aes(label = round(Predicted, 2)), hjust = c(-1.5, -1, -1, -1.5, -1), size = 4) +
annotate("text", label = c(0.19, 0.23, 0.24), x = c(2, 3, 5), y = c(0.19, 0.23, 0.24), hjust = -1, size = 4) +
annotate("text", label = c(0.74, 0.97, 0.99), x = c(2, 3, 5), y = c(0.74, 0.97, 0.99), hjust = -1, size = 4)
To use geom_text, you need to give it labels for each row in the data, but you can just create a label vector that has empty strings ("") for the points you don't want to label:
ggplot(pre_state_t12, aes(site.name, Predicted)) +
geom_pointrange(aes(ymin = lower, ymax = upper), size = 1, stat = "identity") + theme_bw() + ylim(c(0,1)) + xlab("Region") + ylab("Occupancy rate") +
geom_text(aes(label = round(Predicted, 2)), hjust = c(-1.5, -1, -1, -1.5, -1), size = 4) +
geom_text(aes(label = ifelse(lower == Predicted, "", prettyNum(lower)), y = lower)) +
geom_text(aes(label = ifelse(upper == Predicted, "", prettyNum(upper)), y = upper))
Manuel Spínola
Aug 19, 2016, 12:51:24 PM8/19/16
to William Murphy, ggplot2
Thank you very much for all the responses. Creating a new data frame or using annotate solved the problem.
Manuel
----
You received this message because you are subscribed to the ggplot2 mailing list.
Please provide a reproducible example: https://github.com/hadley/devtools/wiki/Reproducibility
To post: email ggp...@googlegroups.com
To unsubscribe: email ggplot2+unsubscribe@googlegroups.com
More options: http://groups.google.com/group/ggplot2
---
You received this message because you are subscribed to the Google Groups "ggplot2" group.
To unsubscribe from this group and stop receiving emails from it, send an email to ggplot2+unsubscribe@googlegroups.com.
For more options, visit https://groups.google.com/d/optout.
Reply all
Reply to author
Forward
0 new messages