How to set agent metrics for managed group
1,234 views
Skip to first unread message

Giorgio Cerruti
Aug 22, 2017, 9:02:34 AM8/22/17
to gce-discussion
I would like to set auto-scaling for my GCE instances. I read the documentations and I understood that I can set a custom metric as the factor to allow google autoscaler to resize my cluster. Now, I would like to set the memory/percent_used as the metric and I did it but what I see is a wrong value because I receive always 100 as the value. Seeing in stackdriver I can see the metric and I also can see the right value. But In StackDriver I see the metric settled like this
memory/percent_used:gce_instance(used, 124567892364, europe-west1-d, project-123456). I tried to set the same in the GCE auto-scale options but I receive an error metric does not exist. Is there someone that can help me and tell me how I can set the right metric or give me some links for reading about this?Giorgio Cerruti
Aug 22, 2017, 9:02:34 AM8/22/17
to gce-discussion
Hi there, I would like to set auto-scaling for my GCE instances. I read the documentations and I understood that I can set a custom metric as the factor to allow google autoscaler to resize my cluster. Now, I would like to set the memory/percent_used as the metric and I did it but what I see is a wrong value because I receive always 100 as the value. Seeing in stackdriver I can see the metric and I also can see the right value. But In StackDriver I see the metric settled like this

Navi Aujla (Google Cloud Support)
Aug 22, 2017, 2:08:14 PM8/22/17
to gce-discussion
Hello Giorgio,
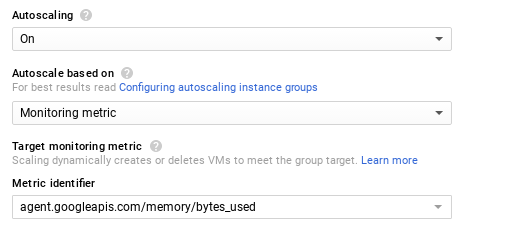
You can enable the auto-scaling for the managed instance groups on GCE [1] using the autoscale policy based on stackdriver monitor metrics. As a prerequisite, the instance must have stackdriver agent installed [2]. You can define the target monitoring metric under the instance group “Edit” option on Google cloud console and set the metric identifier, for example: “agent.googleapis.com/memory/percent_used” [3] in your case or can define any standard or custom metric as per the requirements. Please verify if you are using the valid metric for instance group autoscale policy. You can refer to public help documentation help link [4] for more information on the scaling based on stackdriver monitoring metrics .
Moreover, when checking the stackdriver, verify the filter selected (eg: instance-id) is right for the instance you wants to monitor and appropriate “Aggregation” is selected to view the statistics.
Giorgio Cerruti
Aug 24, 2017, 11:08:48 AM8/24/17
to gce-discussion
Hello Navi,
Thanks a lot for the answer. I believe this metric is not useful for me. I need the used memory percentage expressed and I saw that the metric already has this value but I believe is a separate label. What I see on GCP autoscaling dashboard is 100 value and I suppose is the total memory (100%).
So, do you know how I can read the label that I need to? I mean this "function" shows just the used memory but I believe I can't use this "function" into autoscale group configuration.
gce_instance(used, 124567892364, europe-west1-d, project-123456).
BTW, we would try to make a script for achieving our goal. I have the client installed on my windows machine. I read that I can use libraries of different languages and make my own script which sends metrics to the custom api but I prefer to use the agent for send my custom metrics. So, do you know if there is any possibility to write data somewhere and allow the agent to send data to the stackdrive API?
Navi Aujla (Google Cloud Support)
Aug 24, 2017, 4:22:19 PM8/24/17
to gce-discussion
I am working on testing and replicating to use memory based metric for autoscaling managed instance group, on my end. I will get back to you with more information. Meanwhile, please provide me with your use case and the reason for preferring "memory used" as the managed instance group autoscaler metric.
Moreover, you can create custom metrics [1] and write metric data using the "timeSeries.create" method [2] and use custom metric per your requirement and use in stackdriver. However, please note that not all custom metric can be used by the autoscaler. For more information, please refer to this link[3].
[1] https://cloud.google.com/monitoring/custom-metrics/creating-metrics
[2] https://cloud.google.com/monitoring/custom-metrics/creating-metrics#writing-ts
[3] https://cloud.google.com/compute/docs/autoscaler/scaling-stackdriver-monitoring-metrics#choose_a_valid_custom_metric
Message has been deleted

Paolo Ranieri
Aug 24, 2017, 4:39:05 PM8/24/17
to gce-discussion
Apparently, I am facing exactly the same showstopper Giorgio does.
I did read the documentation and installed the agent in our machine, but I did not find how to specify the type and label as metric identifier in the "autoscale group configuration".
Using the same filter Giorgio shared above (which I suspect he took from Stackdriver), results in an error message stating that "the metric is incorrect or the necessary labels have not been provided".
Answering to Navi's question above for my use-case, in case it helps:
We have created an autoscaling group of Windows Servers.
The Windows Server will execute multiple instances of a memory intensive Windows process usually that Windows process lasts ~20 seconds before terminating). The footprint on CPU, R/W disk and network traffic is minimal.
We are balancing the requests toward the Windows Servers in a different stack, and we ensure the requests are always sent to the Windows Server having the least instances of the memory intensive Windows process in execution.
We need GCE to scale the group when the used RAM exceeds the threshold we set.
Paolo
Giorgio Cerruti
Aug 25, 2017, 3:57:55 AM8/25/17
to gce-discussion
Thanks, Navi.
My use-case is that we have a windows application that receives requests from an application hosted onto GKE cluster through an internal load balancer. That windows application launches (or kills) a new process for every request it receives and these processes are very starved of memory. So, we need to spawn (or close) new windows machine based on the amount of memory used for allowing the application to works. In our case, as in Paolo's case, CPU, disk and network are not very used.
Navi Aujla (Google Cloud Support)
Aug 25, 2017, 3:04:58 PM8/25/17
to gce-discussion
Thanks, Paolo and Giorgio.
I am working on testing the memory as a target metric to autoscale managed instance group. However, I was able to find the memory metric "agent.googleapis.com/memory/bytes_used" [1] as well which may help you. I am working on verifying this metric as target monitoring metric to autoscale the managed instance group as well. I have attached the snapshot from my console screen using the stackdriver metric: "agent.googleapis.com/memory/bytes_used" and I did not receive an error "the metric is incorrect or the necessary labels have not been provided".
I am working on testing the memory as a target metric to autoscale managed instance group. However, I was able to find the memory metric "agent.googleapis.com/memory/bytes_used" [1] as well which may help you. I am working on verifying this metric as target monitoring metric to autoscale the managed instance group as well. I have attached the snapshot from my console screen using the stackdriver metric: "agent.googleapis.com/memory/bytes_used" and I did not receive an error "the metric is incorrect or the necessary labels have not been provided".
I will get back to you with more information.
Giorgio Cerruti
Aug 25, 2017, 4:21:22 PM8/25/17
to Navi Aujla (Google Cloud Support), gce-discussion
I tried all metric at path "agent.googleapis.com/memory" but I did not receive data from "byte_used" and "percent_used" too. I thought that the agent did not send right label as like "zone" or "instance_id" to the metric path maybe.
BTW, thanks a lot for help me, Navi.
--
© 2017 Google Inc. 1600 Amphitheatre Parkway, Mountain View, CA 94043
Email preferences: You received this email because you signed up for the Google Compute Engine Discussion Google Group (gce-dis...@googlegroups.com) to participate in discussions with other members of the Google Compute Engine community and the Google Compute Engine Team.
---
You received this message because you are subscribed to the Google Groups "gce-discussion" group.
To unsubscribe from this group and stop receiving emails from it, send an email to gce-discussio...@googlegroups.com.
To post to this group, send email to gce-dis...@googlegroups.com.
To view this discussion on the web visit https://groups.google.com/d/msgid/gce-discussion/a8017364-8532-4979-b6ae-4bca48b2346e%40googlegroups.com.
For more options, visit https://groups.google.com/d/optout.
--
Kind Regards,
Giorgio Cerruti
Beinnova di Giorgio Cerruti
WebSites | IT consultant | Web Developer
Phone: +39 340/87.68.326 :: Skype: beinnova
P.IVA: 10755560017
Paolo Ranieri
Aug 28, 2017, 6:08:28 AM8/28/17
to gce-discussion
Hello Navi,
I tried to use "agent.googleapis.com/memory/bytes_used" as metric identifier too:
- "agent.googleapis.com/memory/bytes_used" as metric identifier: I always see the message "There is no data for this chart" in the dashboard (I waited hours and refreshed the page multiple times and nothing changed).
- "agent.googleapis.com/memory/percent_used" as metric identifier: I see the dashboard always set to 100.
- "agent.googleapis.com/memory/percent_used" + filter as metric identifier using the StackDriver syntax (see StackDriver Metrics Explorer): I see the error below.
E.g.: agent.googleapis.com/memory/percent_used:gce_instance(6825590977151044225, europe-west1-d, camonline-168614, used)

Navi Aujla (Google Cloud Support)
Aug 28, 2017, 5:01:30 PM8/28/17
to gce-discussion
Hello Giorgio and Paolo,
Thank you for your messages.
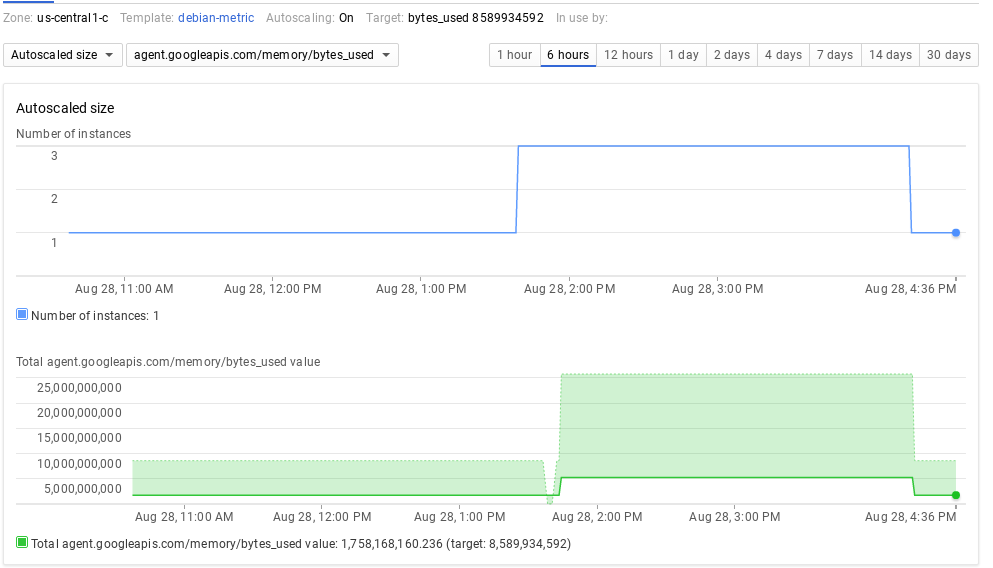
I am able to see the data on the chart for metric identifier “agent.googleapis.com/memory/bytes_used”, I have attached the screenshot as well. If the Stackdriver agent is installed on the instance, you should be able to see the data as well.
Paolo: Did you verify login to the instance in that managed instance group and verified if stack-driver is installed and the memory usage as well?
Moreover, when using “"agent.googleapis.com/memory/percent_used" as a metric identifier, I see the dashboard set to 100 as well.
"agent.googleapis.com/memory/percent_used" + filter as a metric identifier is not a valid metric identifier.
Eg: agent.googleapis.com/memory/percent_used:gce_instance(6825590977151044225, europe-west1-d, camonline-168614, used)
More information regarding the valid memory metric is available at this link [1]. Stackdriver agent installed on the VM instance is responsible to monitor the stackdriver metric defined under metric identifier.
However, I am working on verifying the autoscaling functionality based on the stackdriver memory metric, “percent_memory” metric showing 100 in the dashboard chart and target mode “Gauge” data type (eg: If bits or bytes when byte_used is in use as graph seems to show data in bits) with the backend team.
I will get back to you with more information.
Navi Aujla (Google Cloud Support)
Aug 28, 2017, 6:17:00 PM8/28/17
to gce-discussion
To add to my earlier response, I have tested the above stackdriver target metric on debian image template. I will be verifying on windows server image, managed instance group and will add more information.
Paolo Ranieri
Aug 29, 2017, 6:24:29 AM8/29/17
to gce-discussion
Thanks Navi.
I am glad you noticed the same behavior with the “percent_memory” metric.
I am looking forward to receive your feedback with an instance group of Windows Servers as well as the back-end team's one about the “percent_memory” metric.
Paolo
Navi Aujla (Google Cloud Support)
Aug 29, 2017, 1:54:53 PM8/29/17
to gce-discussion
Thanks for waiting.
I tested with Windows server 2008 R2 image, managed instance group with stackdriver agent installed. When I verify on the stackdriver metric explorer with "agent.googleapis.com/agent/agent/memory_usage", "agent.googleapis.com/memory/bytes_used", it shows no data. I verified the same on managed instance group console dashboard. Now, when I verify the metric "agent.googleapis.com/agent/agent/percent_usage" it seems to shows correct data on the stackdriver metric explorer but on console dashboard it always shows 100.
I am working on verifying this issue with backend team. I will get back with more information.
Navi Aujla (Google Cloud Support)
Aug 31, 2017, 12:28:42 PM8/31/17
to gce-discussion
I verified with the backend team.
The "agent.googleapis.com/memory/percent_used" reflects the both states available from the Windows agent: "used" and "free" which add up to 100%. In brief, it adds up time series (free + used). So, currently cannot be used for the autoscaling windows instance group.
To use it in autoscaling, "state" label to the value "used" when query the metrics. However currently, filtering feature for labels in the metric identifier in autoscaling is not possible.
In addition, currently not all the metrics are reported by Windows stackdriver agent, Here's the list of metrics exported by the Windows agent today:
"agent.googleapis.com/network/tcp_connections" labels: {"port", "tcp_state"}
"agent.googleapis.com/cpu/utilization" labels: {"cpu_state"}
"agent.googleapis.com/memory/percent_used" labels: {"state"}
"agent.googleapis.com/disk/percent_used" labels: {"device", "state"}
"agent.googleapis.com/pagefile/percent_used" labels: {"state"}
"agent.googleapis.com/iis/request_count" labels: {"http_method"}
"agent.googleapis.com/iis/new_connection_count" labels: {}
"agent.googleapis.com/iis/network/transferred_bytes_count" labels: {"direction"}
Backend team is working on adding filtering feature based on the labels in the autoscaler metric identifier, in addition to export metrics which are not currently not exported by Windows stackdriver agent. Also, proposed adding the documentation to avoid any confusion until then.
Giorgio Cerruti
Sep 1, 2017, 6:09:48 AM9/1/17
to gce-discussion
Thanks, Navi. That is exactly as I supposed. Please, let me know when we can use this metric as we expected and thanks for help us.
Giorgio
Giorgio
Navi Aujla (Google Cloud Support)
Sep 7, 2017, 9:37:59 AM9/7/17
to gce-discussion
Hello Giorgio,
Meanwhile, backend team is working on this feature of filtering the label in metric identifier for instance group autoscaling. I have created a public feature request on your behalf, You can track this issue [1] for any updates or comments related to this feature.
[1] https://issuetracker.google.com/issues/65441331
Giorgio Cerruti
Sep 7, 2017, 9:49:44 AM9/7/17
to Navi Aujla (Google Cloud Support), gce-discussion
Thanks, Navi. I appreciate that.
--
© 2017 Google Inc. 1600 Amphitheatre Parkway, Mountain View, CA 94043
Email preferences: You received this email because you signed up for the Google Compute Engine Discussion Google Group (gce-dis...@googlegroups.com) to participate in discussions with other members of the Google Compute Engine community and the Google Compute Engine Team.
---
You received this message because you are subscribed to the Google Groups "gce-discussion" group.
To unsubscribe from this group and stop receiving emails from it, send an email to gce-discussio...@googlegroups.com.
To post to this group, send email to gce-dis...@googlegroups.com.
To view this discussion on the web visit https://groups.google.com/d/msgid/gce-discussion/bb120933-44f4-491a-832a-3e6d05493d4b%40googlegroups.com.
For more options, visit https://groups.google.com/d/optout.
Message has been deleted

Abhishek Jain
Jun 7, 2020, 12:50:49 PM6/7/20
to gce-discussion
Hi Giorgio,
Did you get solution for your question. I am facing the same issue.
To unsubscribe from this group and stop receiving emails from it, send an email to gce-dis...@googlegroups.com.
To post to this group, send email to gce-dis...@googlegroups.com.
To view this discussion on the web visit https://groups.google.com/d/msgid/gce-discussion/bb120933-44f4-491a-832a-3e6d05493d4b%40googlegroups.com.
For more options, visit https://groups.google.com/d/optout.
Shanewaz Ahmed
Jun 9, 2020, 12:28:02 PM6/9/20
to gce-discussion
Hi, I have already followed up with the product team regarding this. We have a PIT on this though unable to provide ETA for this and further update will be followed there.
Reply all
Reply to author
Forward
0 new messages