Feature Request: Side-by-side comparison of graphs in same time range
瀏覽次數:16 次
跳到第一則未讀訊息

Brad Wood
2014年12月11日 下午4:23:142014/12/11
收件者:fusion...@googlegroups.com
Consider this a feature request, unless it is already possible-- in which case please let me know how to do it :)
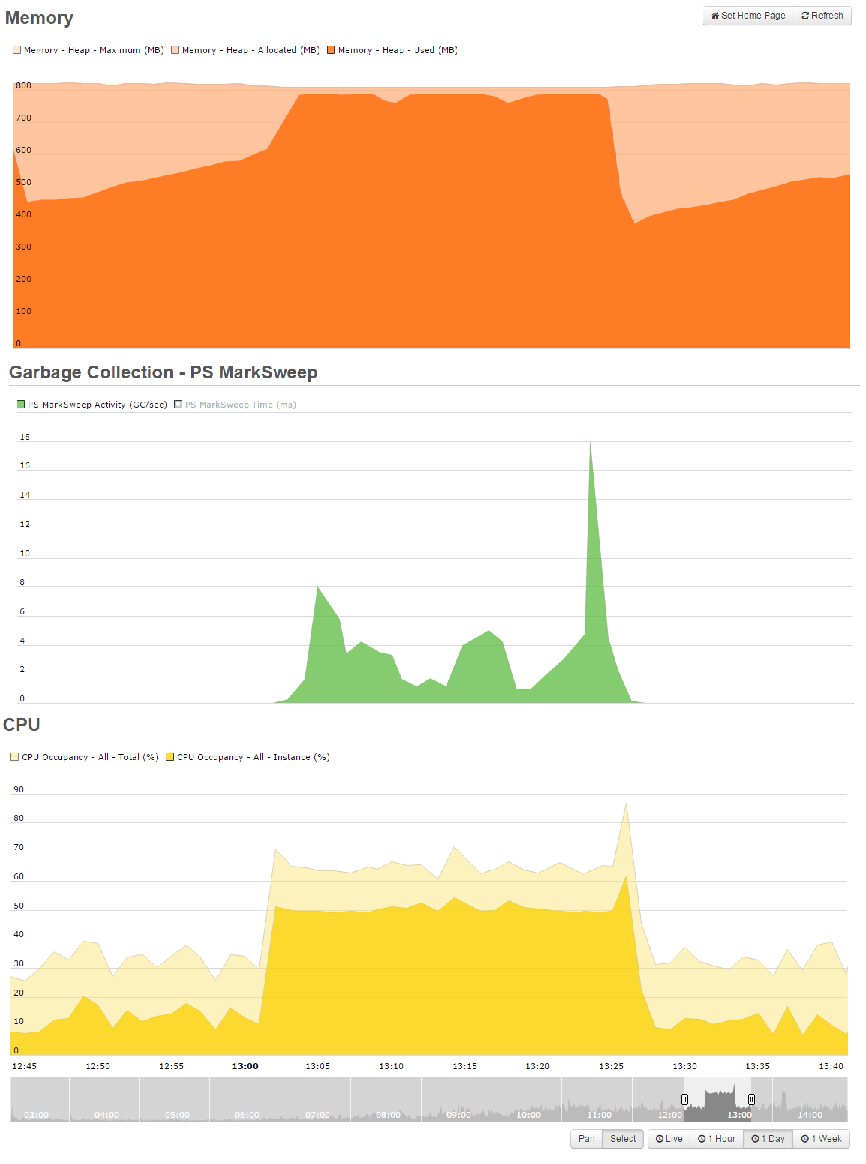
Often times when going back to review a "trouble period" earlier in day with Fusion Reactor I'll want to cross reference several graphs at the same time. For instance, right now I'm looking at a one hour time slot on a server and I have three browser tabs open all zoomed into the same time range in "day" mode:
- One showing heap memory usage
- One showing garbage collection times
- One showing CPU usage for that time
What I would like to be able to do is choose 2 or more resources that I want to see at once on the same page, and then just have one set of controls to choose "day" and dial in my time range and all the graphs will update at the same time, stacked on top of each other so I can easily visualize the correlations. Attached is an artists rendition of what I'm imagining. Ok, it's actually me messing with PaintBrush :)
I love the "Web Metrics" page because it let's me see several graphs at once, but they can only be set to "Last Minute" and "Last Hour" with no pan and zoom.
Even better than this would be the ability to save one of these custom screens to refer back to it.
Thoughts?
Thanks!
~Brad

Darren Pywell
2014年12月12日 上午10:58:512014/12/12
收件者:fusion...@googlegroups.com
Hi Brad,
Thank you for the question/inputs. Tracked for FR and FR Cloud.
It should be possible to get close to this already in FR5 using URL params. For example:
You need to know the names of the GC spaces. Those are shown on the GC graphs page for your engine because they can be different for each JVM version and configuration. You can also use /activity instead of /time on the GC series.
You can keep the URL's as a way of saving the graphs you like.
Hope that helps.
Cheers,
Darren
Brad Wood
2014年12月12日 下午1:01:212014/12/12
收件者:fusionreactor
On Fri, Dec 12, 2014 at 9:58 AM, Darren Pywell <dapy...@googlemail.com> wrote:
You can keep the URL's as a way of saving the graphs you like.
Ohh, very nice trick indeed! I think I might like stacking the series on the same chart even better than separate ones. The fact that I can turn series on and off by clicking their little color square helps in case one is blocking the other.
You could really just make a little custom chart builder page that works like the popup on the Web Metrics page where I can add series and choose their color. Thanks for considering the enhancement!
Thanks!
~Brad
ColdBox Platform Evangelist
Ortus Solutions, Corp
E-mail: br...@coldbox.org
ColdBox Platform: http://www.coldbox.org
Darren Pywell
2014年12月15日 下午4:03:382014/12/15
收件者:fusion...@googlegroups.com
Thanks for the feedback Brad. I'll talk this over with the team as well as your other points.
Thanks,
Darren
回覆所有人
回覆作者
轉寄
0 則新訊息