Diminishing GC times
20 views
Skip to first unread message

Brad Wood
Dec 11, 2014, 9:49:10 PM12/11/14
to fusionreactor
I'm dealing with some rather long GC pauses on a server right now and I've noticed it's impossible to see how long the collection took after a minute has passed. That's because the length of the collection doesn't show the same between the "live", "hour", and "day" graphs. I assume there's some kind of averaging going on, but I wanted to make sure. In this particular instance full GCs tend to be sort of far apart and I'm more interested in the exact value of each as opposed to the average of a bunch of them (mostly because there isn'ta bunch of them :)
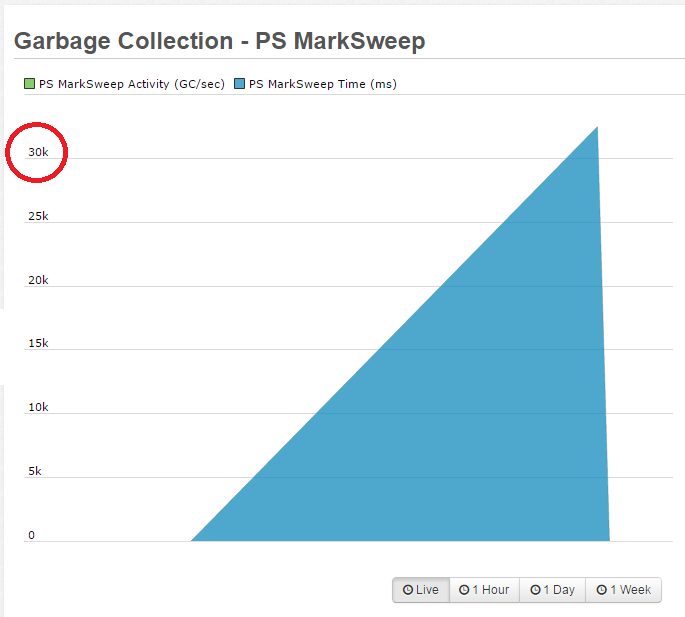
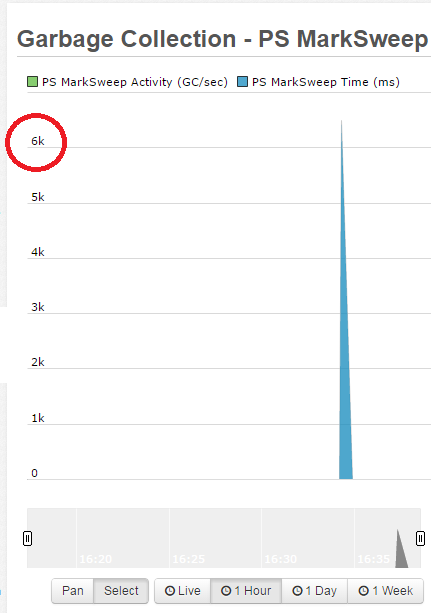
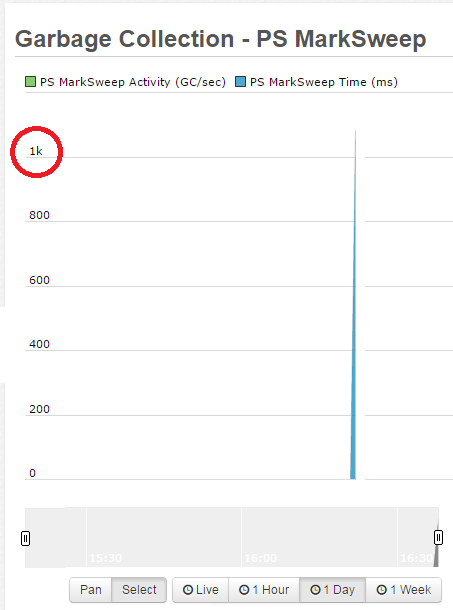
These three screen grabs are of the same GC pause, but taken from the Live, hour, and day modes. Nothing was panned or zoomed, but I didn't crop the images to make them smaller.
The Live view shows a 30 second pause, while the hour view shows a 30 second pause, and the day view shows a 1 second pause. Obviously that's a pretty significant difference and makes the hour and day views difficult to see just how long my longest GC pause was that day.
Thanks!
~Brad
ColdBox Platform Evangelist
Ortus Solutions, Corp
E-mail: br...@coldbox.org
ColdBox Platform: http://www.coldbox.org

Darren Pywell
Dec 12, 2014, 10:33:18 AM12/12/14
to fusion...@googlegroups.com
Hi Brad,
You're right! The live graphs shows 1 second samples as they are being taken which gives a very accurate image of what's happening right now. As the time period is increased we try to keep the resolution (number of points) on the graphs as high we can but we cannot store all of the 1 second samples for an entire day or a week locally. As a result we average the samples into a lower resolution (in the case of 1hour we use 5 seconds which is still pretty high res). When you have a bunch of samples then this will have little effect on the values but when the sample set is small or the values vary greatly on just a few points you lose the peaks. One solution may be for us to show the maximum values as well :-)
Thanks!
Darren
Brad Wood
Dec 12, 2014, 12:57:56 PM12/12/14
to fusionreactor
Thanks for the confirmation. Question though, if the GC in question is the only one for a 5-10 minute period and certainly the only one for that 5-second span wouldn't it be the only sample collected in that time frame? Meaning, the average of 30 seconds would still be 30 seconds. Unless, of course, you're counting the lack of GCs as 0-second GCs but I'm not sure that would make statistical sense (even though it might work for a request/sec type counter). Let me know if the graph works differently.
I think the max value could be a very nice way to solve this issue. I've noticed the same behavior with counters such as request times as well so it could be nice to know the max there as well.
Thanks!
~Brad
ColdBox Platform Evangelist
Ortus Solutions, Corp
E-mail: br...@coldbox.org
ColdBox Platform: http://www.coldbox.org
--
You received this message because you are subscribed to the Google Groups "FusionReactor" group.
To unsubscribe from this group and stop receiving emails from it, send an email to fusionreacto...@googlegroups.com.
To post to this group, send email to fusion...@googlegroups.com.
Visit this group at http://groups.google.com/group/fusionreactor.
For more options, visit https://groups.google.com/d/optout.
Darren Pywell
Dec 15, 2014, 4:02:18 PM12/15/14
to fusion...@googlegroups.com
Hi Brad,
I think it's acting as a sampler, so a sample will be taken every second of the activity (i.e. not a sparse metric post). I'll look into the idea of using a sparse metric and showing max values with the team.
Many Thanks for the feedback,
Darren
To unsubscribe from this group and stop receiving emails from it, send an email to fusionreactor+unsubscribe@googlegroups.com.
Reply all
Reply to author
Forward
0 new messages