Fluentd memory leak?
1,946 views
Skip to first unread message

jc...@atlassian.com
Aug 2, 2015, 9:59:08 PM8/2/15
to Fluentd Google Group
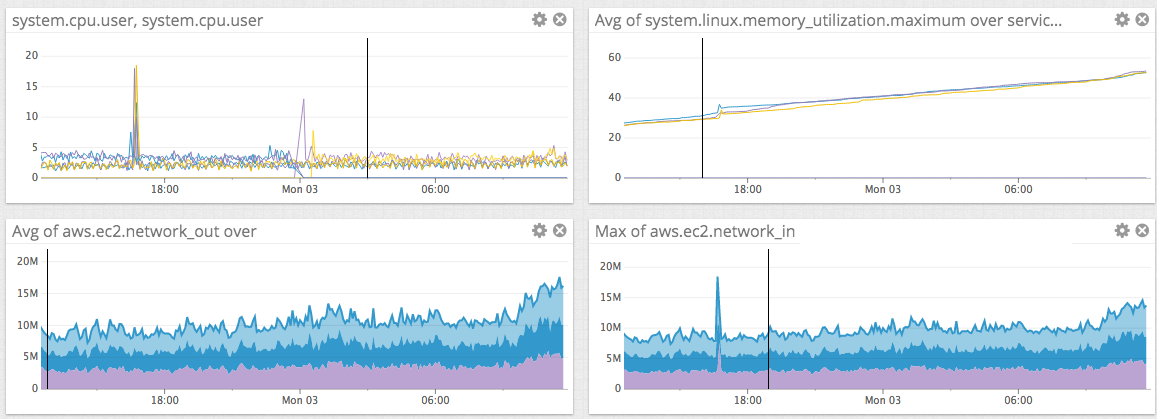
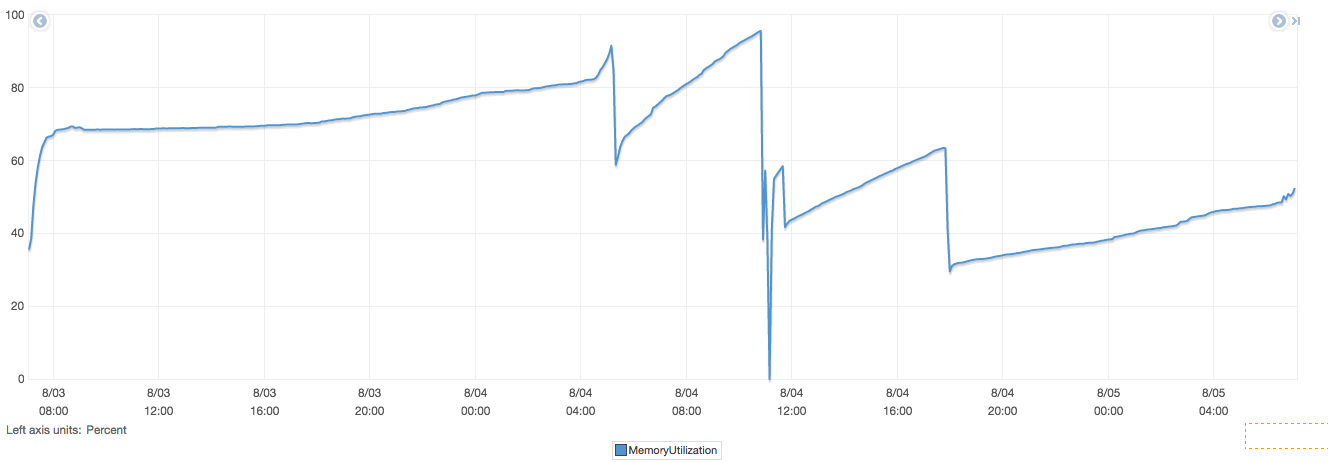
I'm running fluentd in a production environment. Our setup is the same as the one describe here http://docs.fluentd.org/articles/high-availability where individual nodes send logs to the aggregator node and aggregator will send logs to kinesis. The aggregator consist of 3 t2.small EC2 instances sit behind an elb. However, as you can see from the file attached, the network in/out was fine but the memory usage of fluentd keep going up from ~25% to ~60% (see machine_matrics attachment), eventually it will go up to ~90% and got killed by the OOM killer
This is my fluentd config:
<source>
type forward
port 8080
</source>
# Output
<match logs.**>
type kinesis
stream_name "#{ENV['STREAM_NAME']}"
region "#{ENV['AWS_REGION']}"
aws_key_id "#{ENV['AWS_ACCESS_KEY']}"
aws_sec_key "#{ENV['AWS_ACCESS_SECRET_KEY']}"
http_proxy "#{ENV['HTTP_PROXY']}"
random_partition_key
# kinesis retries
retries_on_putrecords 10
# multi-thread config
detach_process 2
num_threads 15
# buffering
buffer_type file
buffer_path /var/log/fluent/log-aggregator.*.buffer
buffer_chunk_limit 8m
buffer_queue_limit 512
flush_at_shutdown true
flush_interval 10s
# fluentd retries
disable_retry_limit false
retry_limit 10
</match>
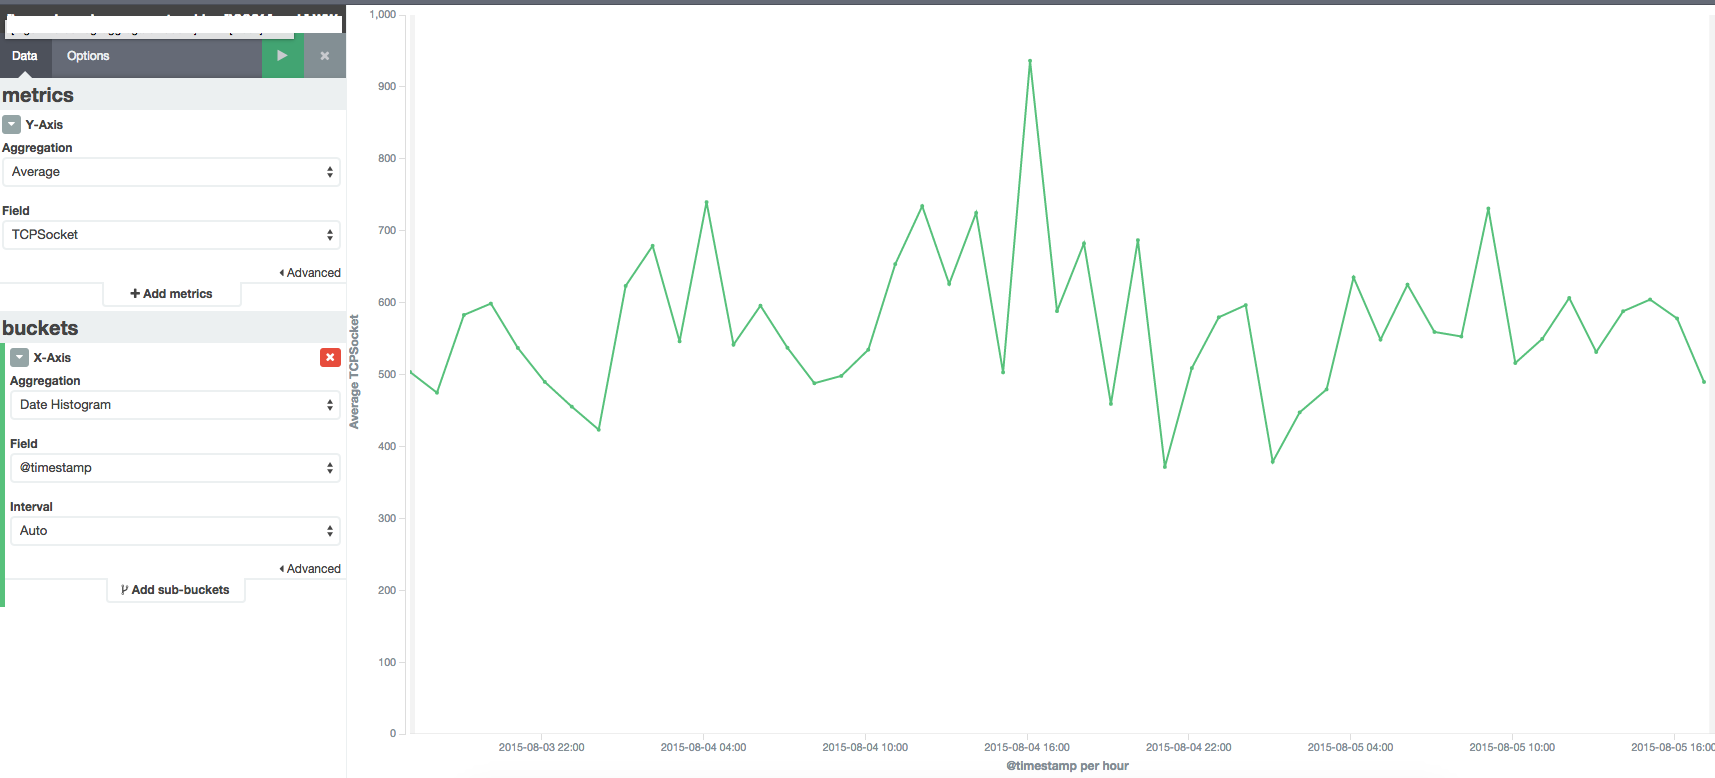
Some other strange things i see, i see a ~150 open tcp connections and ~130 are in TIME_WAIT state (ELB uses TCP healthcheck on port 8080).
See attachment for more info about gc_stat and object_space output.
Any one has similar problems?

Mr. Fiber
Aug 2, 2015, 10:46:39 PM8/2/15
to Fluentd Google Group
I'm not sure why there are lots of TIME_WAIT state sockets.
How ELB handle RST / FIN packet of connections?
How many connections from forwarder to aggregator?
How about setting net.ipv4.tcp_tw_reuse = 1?
Masahiro
--
You received this message because you are subscribed to the Google Groups "Fluentd Google Group" group.
To unsubscribe from this group and stop receiving emails from it, send an email to fluentd+u...@googlegroups.com.
For more options, visit https://groups.google.com/d/optout.
jc...@atlassian.com
Aug 2, 2015, 11:52:48 PM8/2/15
to Fluentd Google Group
1. We have ~140 forwarder at the moment, so now the ~150 tcp connection seems reasonable for me now.
Here are the TIME_WAIT connections:
$ netstat | grep TIME_WAIT | wc -l
123
$ netstat | grep TIME_WAIT | wc -l
127
$ netstat | grep TIME_WAIT | wc -l
129
$ netstat | grep TIME_WAIT | wc -l
133
$ netstat | grep TIME_WAIT | wc -l
133
$ netstat | grep TIME_WAIT | wc -l
135
$ netstat | grep TIME_WAIT | wc -l
119
$ netstat | grep TIME_WAIT | wc -l
121
So the connections did get closed.
2. I can't find any documentation online documenting how ELB handles FIN/RST packet, but there is a connection timeout if there is no data for 60 seconds.
3. I will try net.ipv4.tcp_tw_reuse
Let me know what other information you need.
jc...@atlassian.com
Aug 2, 2015, 11:57:48 PM8/2/15
to Fluentd Google Group
Also stats from top:
$ top
top - 03:13:55 up 1 day, 1:30, 1 user, load average: 0.00, 0.01, 0.05
Tasks: 116 total, 2 running, 114 sleeping, 0 stopped, 0 zombie
%Cpu(s): 1.7 us, 0.7 sy, 0.0 ni, 96.0 id, 0.0 wa, 0.0 hi, 1.3 si, 0.3 st
KiB Mem: 2048524 total, 1947088 used, 101436 free, 192192 buffers
KiB Swap: 0 total, 0 used, 0 free. 643236 cached Mem
PID USER PR NI VIRT RES SHR S %CPU %MEM TIME+ COMMAND
3021 root 20 0 662364 63760 2720 S 1.0 3.1 21:17.79 fluentd
7 root 20 0 0 0 0 S 0.3 0.0 1:34.70 rcu_sched
8 root 20 0 0 0 0 R 0.3 0.0 4:50.08 rcuos/0
2265 td-agent 20 0 248432 67028 5004 S 0.3 3.3 3:25.26 ruby
2570 dd-agent 20 0 148476 22540 5328 S 0.3 1.1 1:43.68 python
3026 root 20 0 728896 337224 3848 S 0.3 16.5 7:47.26 fluentd
3032 root 20 0 731760 344124 3848 S 0.3 16.8 7:49.64 fluentd
1 root 20 0 33616 2956 1496 S 0.0 0.1 0:01.50 init
On Monday, August 3, 2015 at 12:46:39 PM UTC+10, repeatedly wrote:
Mr. Fiber
Aug 3, 2015, 3:35:42 AM8/3/15
to Fluentd Google Group
> 1. We have ~140 forwarder at the moment, so now the ~150 tcp connection seems reasonable for me now.
I see
From your attached image, incoming traffic is increasing.
Memory usage is increased with same traffic?
jc...@atlassian.com
Aug 4, 2015, 12:38:46 AM8/4/15
to Fluentd Google Group
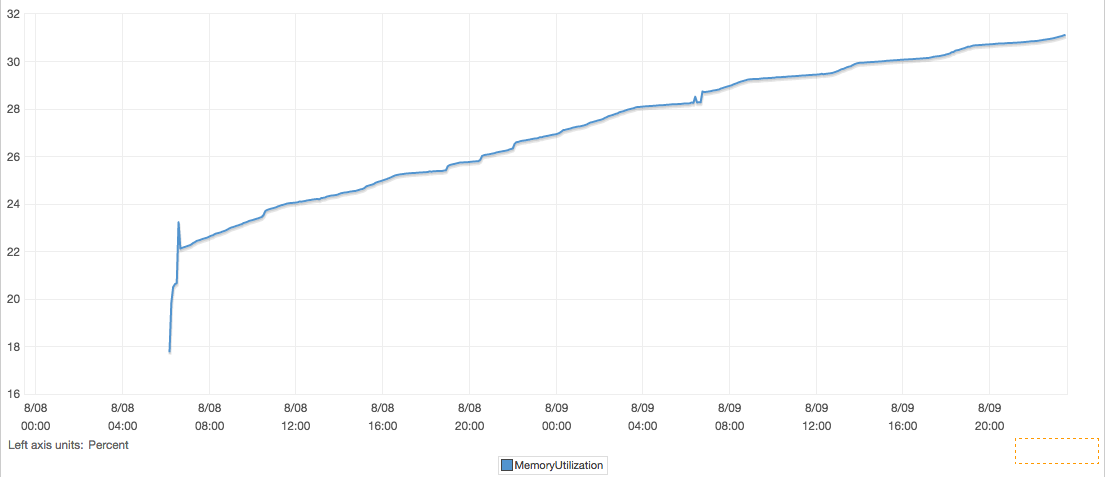
The memory usage keep going up even though the traffic is constant. As you can see from the attachment.
Currently I set the RUBY_GC_OLDMALLOC_LIMIT_MAX and RUBY_GC_MALLOC_LIMIT_MAX to a small value and see if more frequent GC helps with the situation.
jc...@atlassian.com
Aug 5, 2015, 3:19:56 AM8/5/15
to Fluentd Google Group
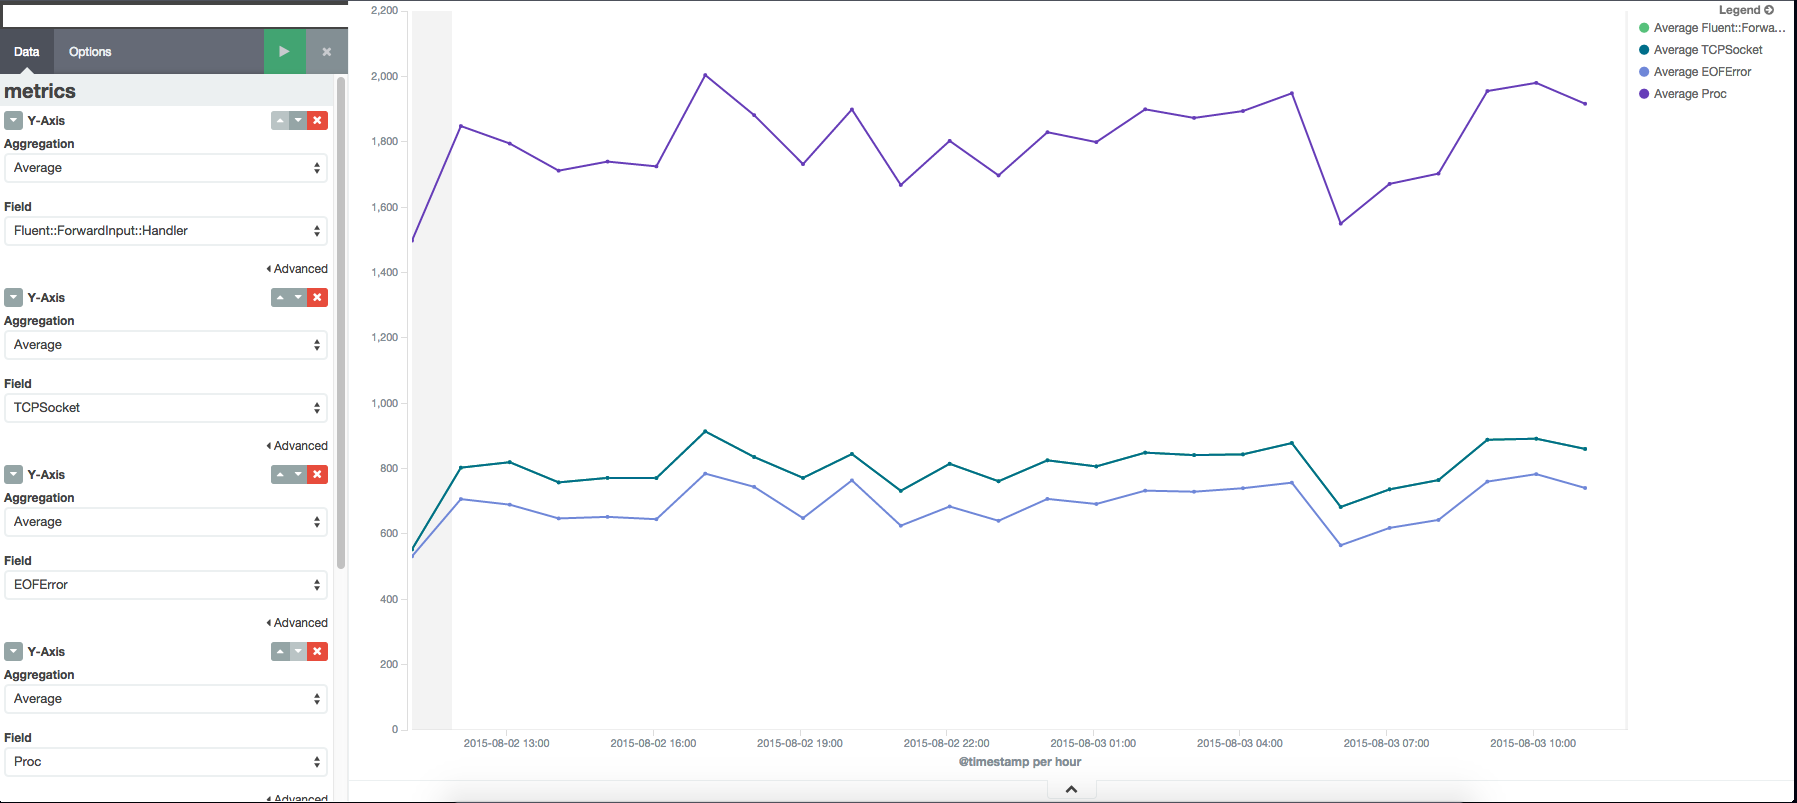
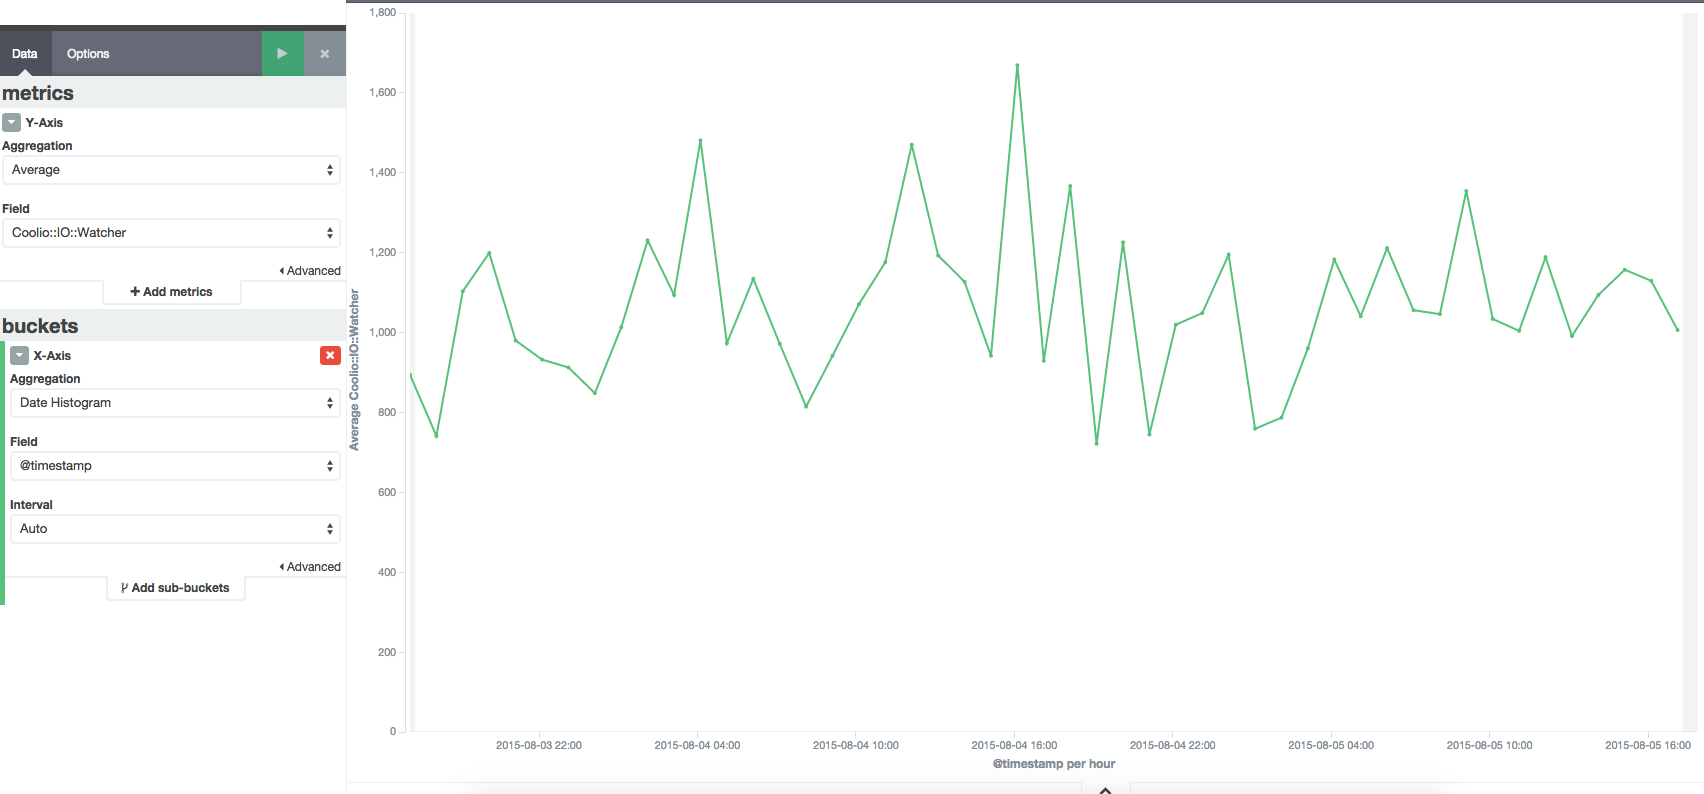
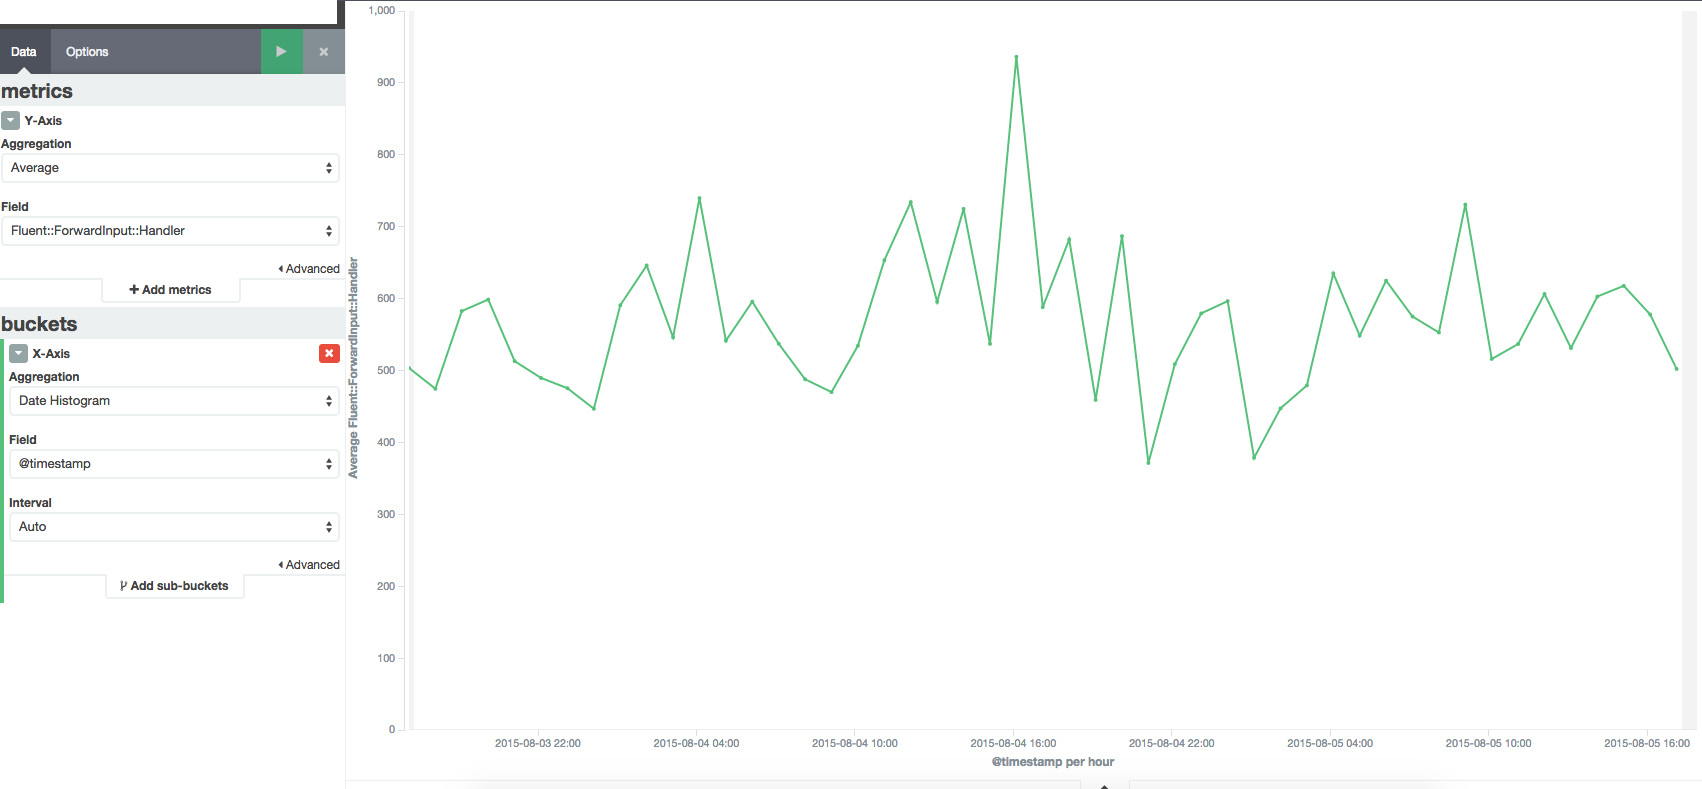
Memory Usage still keep going up :( The number of fluentd forward handler, CoolIOWatcher and TCP socket objects looks suspicious. I don't think there would be that many connections going in. However, I don't really see a direct correlation between all these metrics.
Mr. Fiber
Aug 5, 2015, 6:37:12 AM8/5/15
to Fluentd Google Group
That's weird.
How about using other output plugin instead of kinesis?
I want to know which is the problem, input or output.

Lance N.
Aug 8, 2015, 8:07:47 PM8/8/15
to Fluentd Google Group
Perhaps old threads are piling up and not being harvested? Can you graph the number of threads in the Fluentd process?
jc...@atlassian.com
Aug 9, 2015, 7:38:06 PM8/9/15
to Fluentd Google Group
I deployed a version with the null output plugin over the weekend. Here is the config:
<system>suppress_repeated_stacktracesuppress_config_dump</system># Input
<source>type forwardport 8080</source>
<match fluent.**>type filepath /var/log/fluent/log-aggregator</match># Output<match logs.**>type null</match>
See attachment for the result. The memory usage still keep going up. (It didn't go up as fast but this is not in production so the load is much lower.)

Naotoshi Seo
Aug 9, 2015, 11:48:34 PM8/9/15
to Fluentd Google Group
Need to investigate.
Can you try to stop using <system></system> config?
If it still grows memory, can you also try --no-supervisor option?
Regards,
Naotoshi a.k.a sonots
jc...@atlassian.com
Aug 17, 2015, 6:22:29 AM8/17/15
to Fluentd Google Group
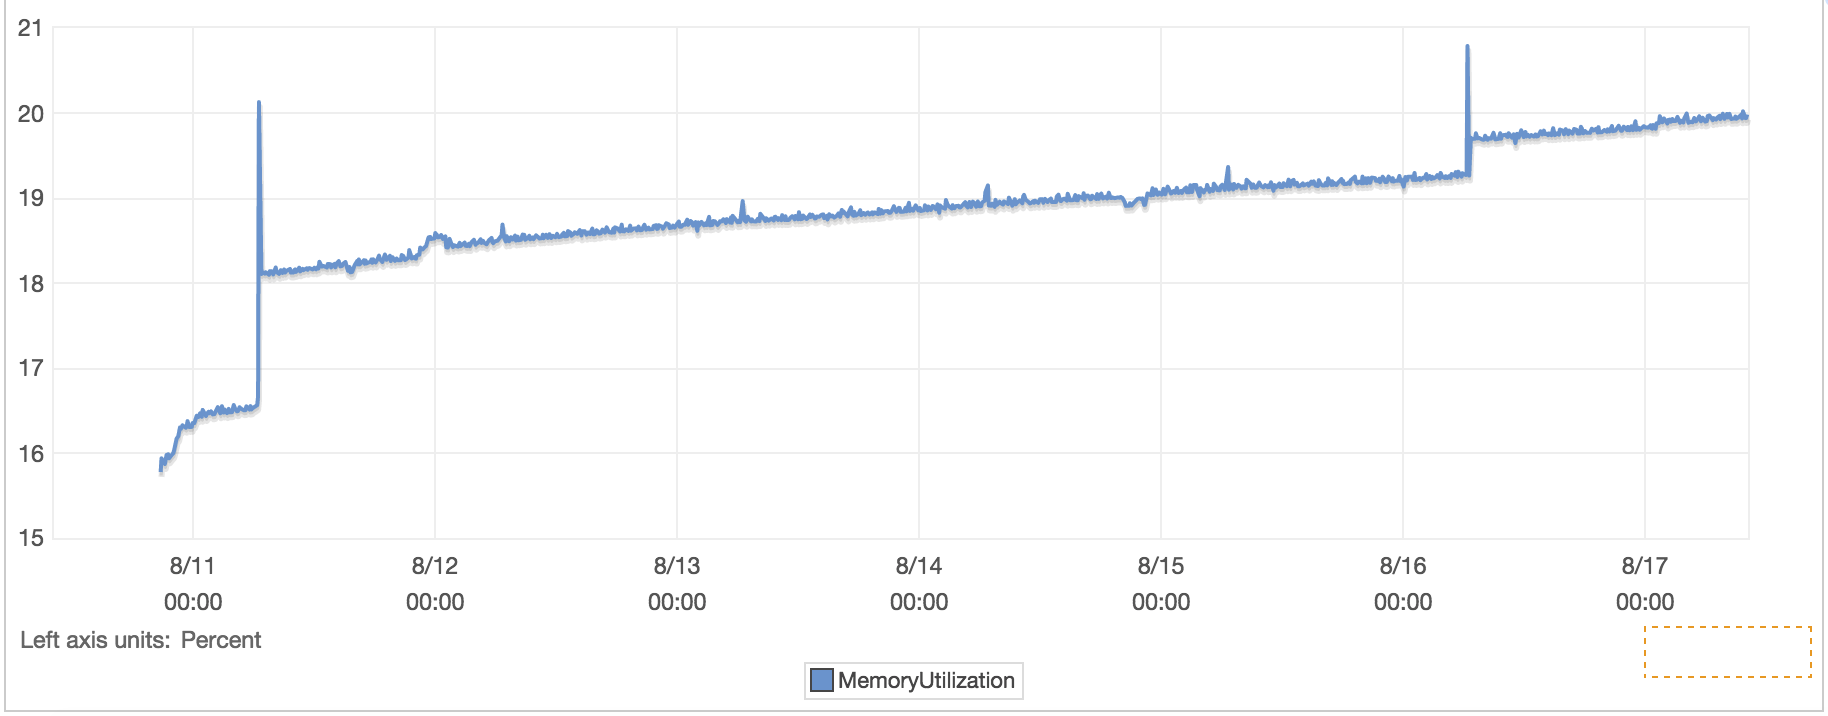
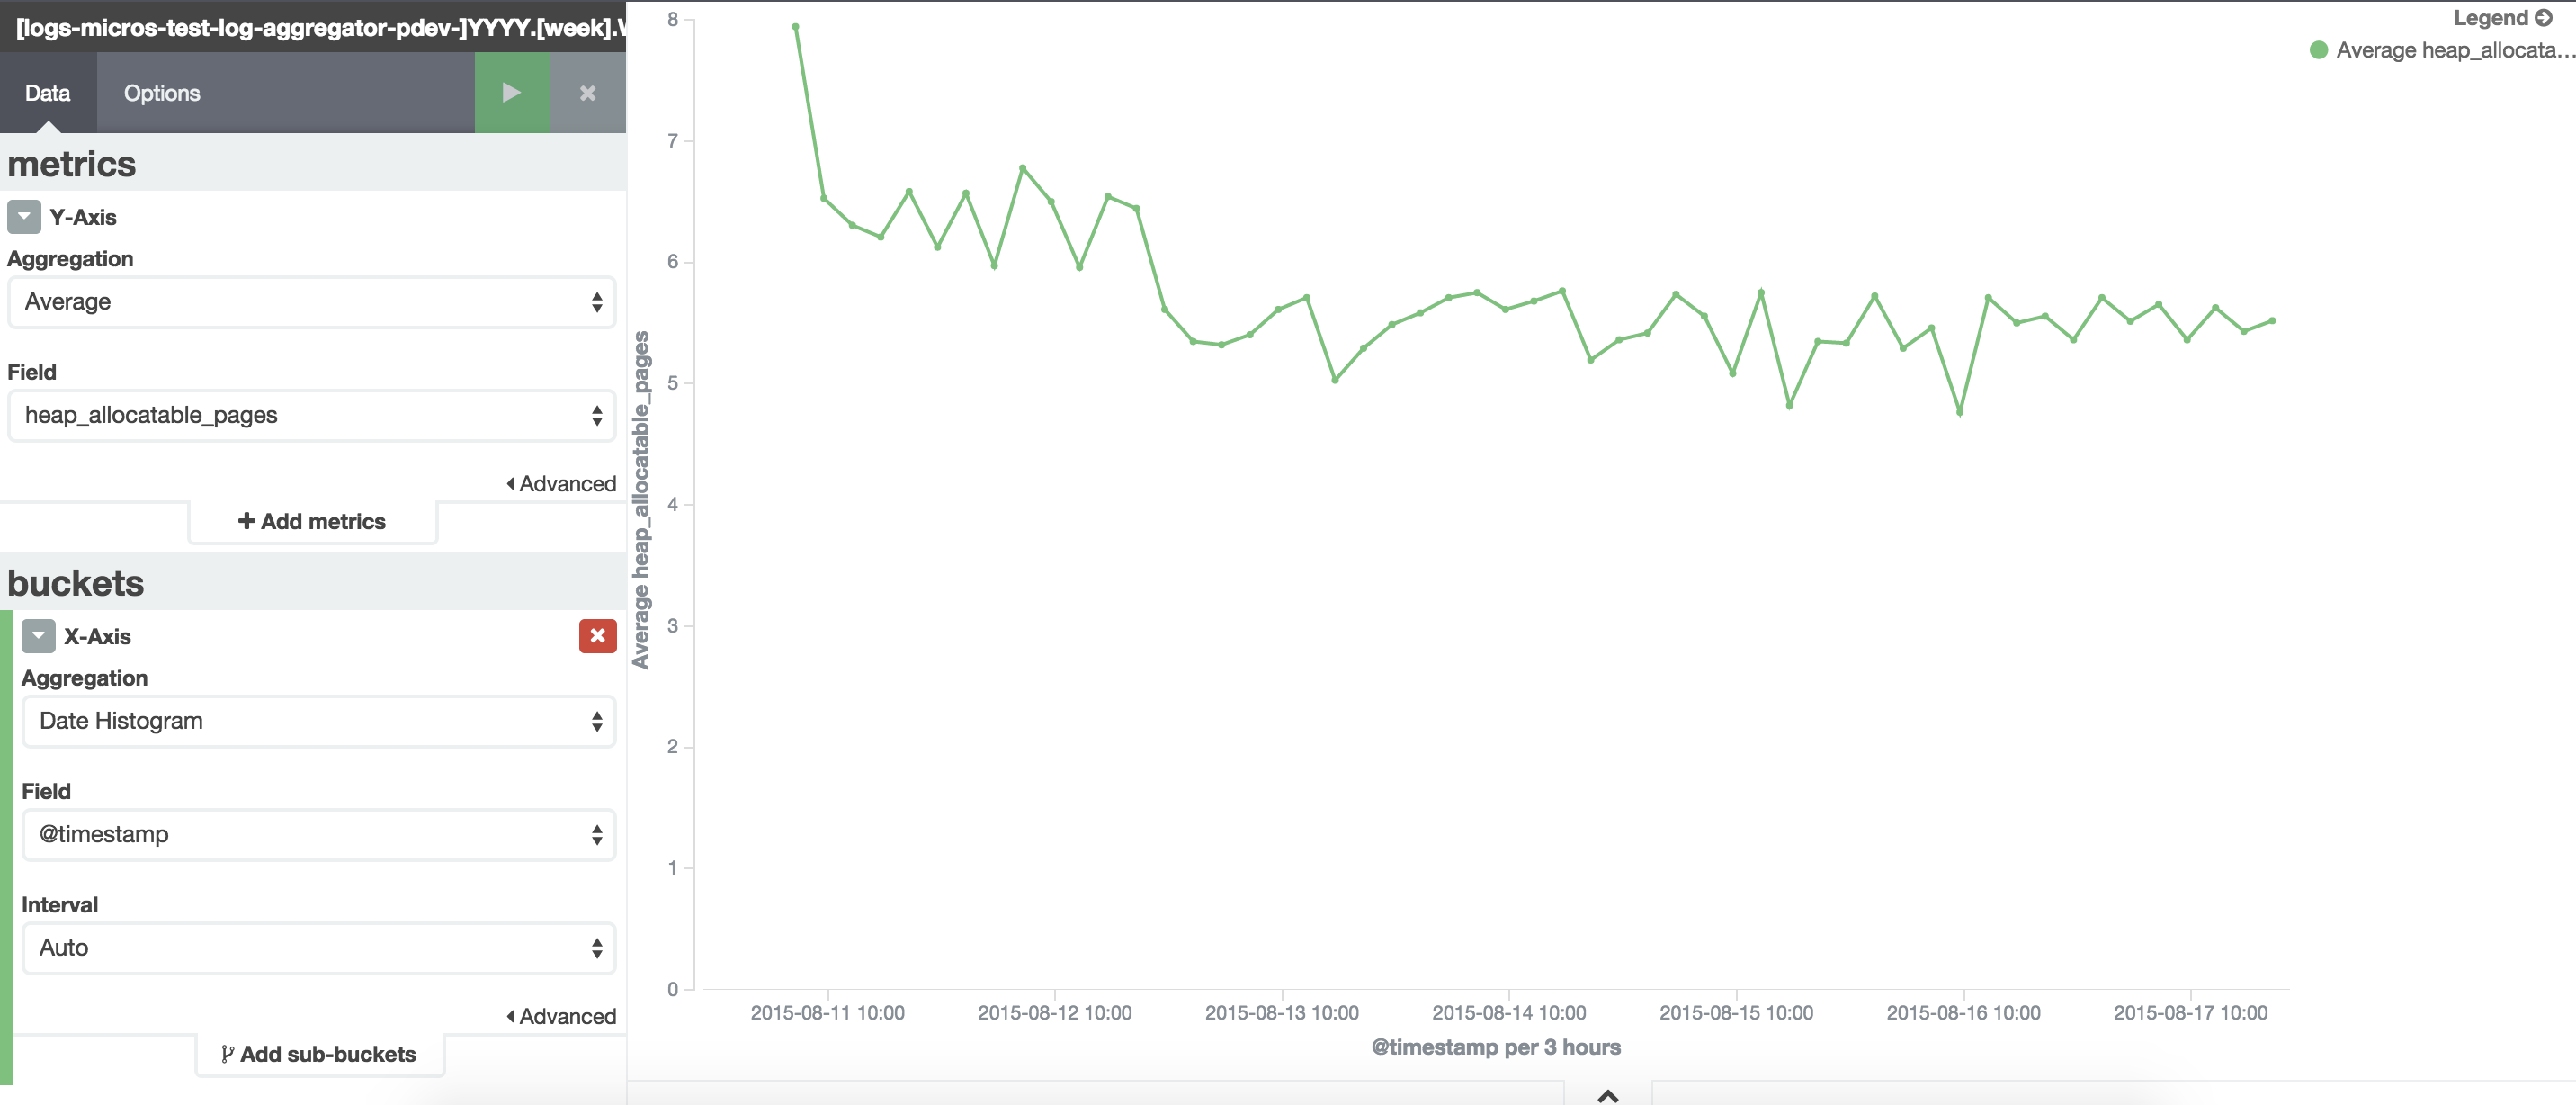
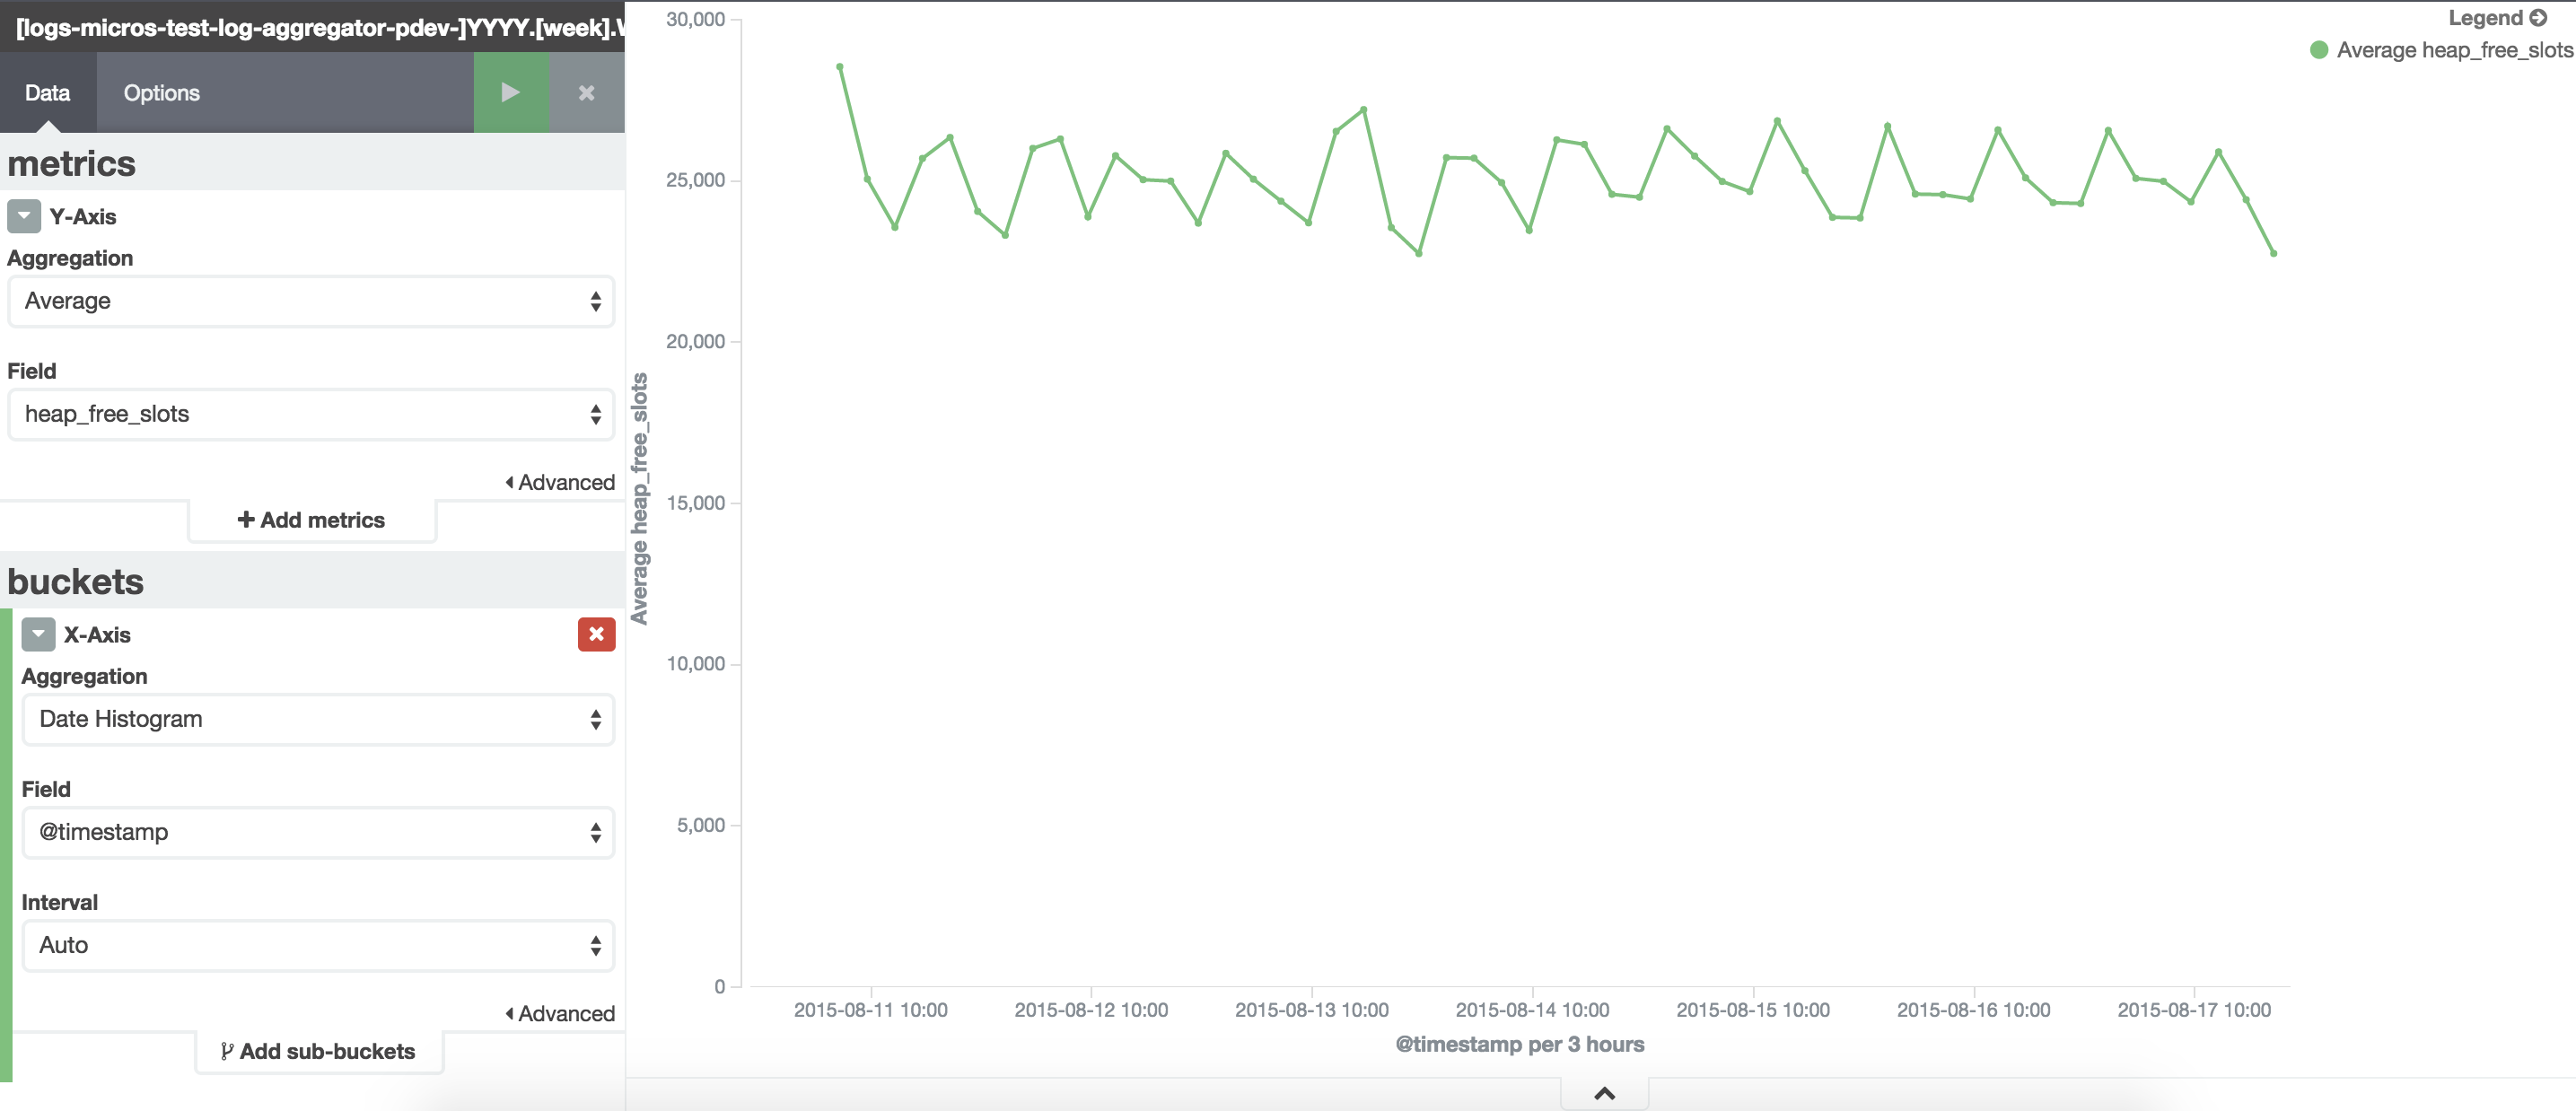
Sorry for taking so long to reply, things are busy here. I've created a aggregator that doesn't actually aggregate logs (no traffic from individual nodes, only from ELB).
I've attached some metrics I collected.
Next step I will do what you suggested to see if it makes a difference.
Thanks!

no jihun
Sep 2, 2015, 6:48:35 PM9/2/15
to Fluentd Google Group
any updates?
Mr. Fiber
Sep 2, 2015, 11:45:29 PM9/2/15
to Fluentd Google Group
Do you hit this problem too?
no jihun
Sep 3, 2015, 1:37:47 AM9/3/15
to Fluentd Google Group
I'm not sure this is an same situation with jc..
but as you can see fluentd process suddenly consumed up the machine's ram.
in usual, fluentd consume about 50MB of RAM(this is approximately 0.84% of total RAM).
this is the fluentd ram consum statuses by minutes.
MEM(RAM) field keeps 0.85% until 2015-08-31 16:04.
currently I do not exactly know why the memory tracking did not made logs during 30minutes(16:05~16:32)
not only this day but also other days fluentd consumed very large memory.


here is my conf
<source>
type monitor_agent
bind 0.0.0.0
port 24220
</source>
<source>
type tail
path /home1/logs/offerwall/offerwall.20*.log
pos_file /home1/.fluentd/offerwall_tail_pos.log
refresh_interval 5
tag offerwall.log
format json
log_level error
</source>
<match offerwall.log>
type elasticsearch
buffer_type file
buffer_path /home1/.fluentd/buffer/offerwall.*.buffer
buffer_chunk_limit 32m
buffer_queue_limit 1024
logstash_format true
utc_index true
flush_interval 3
disable_retry_limit true
retry_wait 5
request_timeout 10
num_threads 1
hosts 10.98---------------
port 9200
type_name dodol.analytics.real
</match>
$ gem list
*** LOCAL GEMS ***
bigdecimal (1.2.6)
cool.io (1.3.0)
elasticsearch (1.0.9)
elasticsearch-api (1.0.9)
elasticsearch-transport (1.0.9)
excon (0.45.3)
faraday (0.9.1)
fluent-plugin-elasticsearch (0.8.0)
fluentd (0.12.8)
http_parser.rb (0.6.0)
io-console (0.4.3)
json (1.8.1)
msgpack (0.5.11)
multi_json (1.11.0)
multipart-post (2.0.0)
psych (2.0.8)
rake (10.4.2)
rdoc (4.2.0)
sigdump (0.2.2)
string-scrub (0.0.5)
thread_safe (0.3.5)
tzinfo (1.2.2)
tzinfo-data (1.2015.4)
yajl-ruby (1.2.1)
this is the fluent's log about that time
2015-08-31 11:16:07 +0900 [info]: plugin/in_tail.rb:477:initialize: following tail of /home1/logs/offerwall/offerwall.2015-08-31.log
2015-08-31 11:16:07 +0900 [info]: plugin/in_tail.rb:477:initialize: following tail of /home1/logs/offerwall/offerwall.2015-08-24.log
2015-08-31 11:16:07 +0900 [info]: plugin/in_tail.rb:477:initialize: following tail of /home1/logs/offerwall/offerwall.2015-08-28.log
2015-08-31 11:16:07 +0900 [info]: plugin/in_tail.rb:477:initialize: following tail of /home1/logs/offerwall/offerwall.2015-08-23.log
2015-08-31 11:16:07 +0900 [info]: plugin/in_tail.rb:477:initialize: following tail of /home1/logs/offerwall/offerwall.2015-08-26.log
2015-08-31 11:16:11 +0900 [info]: plugin/out_elasticsearch.rb:67:client: Connection opened to Elasticsearch cluster => {:host=>"10.9...", :port=>9200, :scheme=>"http"}, {:host=>"10.98....", :port=>9200, :scheme=>"http"}, {:host=>"10.98.1...", :port=>9200, :scheme=>"http"}, {:host=>"10.9...1", :port=>9200, :scheme=>"http"}
2015-08-31 16:04:42 +0900 [info]: plugin/in_tail.rb:477:initialize: following tail of /home1/logs/offerwall/offerwall.20.restore.2nd.log
2015-09-01 00:01:01 +0900 [info]: plugin/in_tail.rb:387:on_rotate: detected rotation of /home1/logs/offerwall/offerwall.2015-08-22.log; waiting 5 seconds
2015-09-01 09:00:04 +0900 [info]: plugin/in_tail.rb:477:initialize: following tail of /home1/logs/offerwall/offerwall.2015-09-01.log
2015-09-01 12:06:29 +0900 [info]: plugin/in_tail.rb:477:initialize: following tail of /home1/logs/offerwall/offerwall.20.restore.3nd.log
I suspect in_tail or elasticsearch plugin.
at 16:04:42 I operated some command like this.
$ touch offerwall.20.restore.2nd.log
(waited until fluentd tailing new file.)
$ cat somelargefile >> offerwall.20.restore.2nd.log
(somelargefile's size is near 200MB)
from when I restarted fluentd process after got sms notification now (24hours), fluentd's ram usage not going high.(keep under 50mb)
what can I provide more information?
2015년 9월 3일 목요일 오후 12시 45분 29초 UTC+9, repeatedly 님의 말:
Naotoshi Seo
Sep 3, 2015, 9:05:27 AM9/3/15
to flu...@googlegroups.com
It looks logs of old days appeared at a moment, and it caused the increase of memory. So, it looks it is not a memory leak.
> 2015-08-31 11:16:07 +0900 [info]: plugin/in_tail.rb:477:initialize: following tail of /home1/logs/offerwall/offerwall.2015-08-24.log
> 2015-08-31 11:16:07 +0900 [info]: plugin/in_tail.rb:477:initialize: following tail of /home1/logs/offerwall/offerwall.2015-08-28.log
> ....
If these logs appeared on the moment, someone writing the offerwall logs is doing something wrong.
If these logs already existed, but in_tail started following the log at the moment, in_tail is doing something wrong.
Can you check your situation?
Regards,
Naotoshi
no jihun
Sep 3, 2015, 6:34:25 PM9/3/15
to flu...@googlegroups.com
this logs caused by fluentd restarting.
because old files kept for 7days.
> 2015-08-31 11:16:07 +0900 [info]: plugin/in_tail.rb:477:initialize: following tail of /home1/logs/offerwall/offerwall.2015-08-24.log
> 2015-08-31 11:16:07 +0900 [info]: plugin/in_tail.rb:477:initialize: following tail of /home1/logs/offerwall/offerwall.2015-08-28.log
> ....
and this time is 3 hours earlier than memory going high moment.
also no duplicated document indexed in elasticsearch.
at the picture until 14 pm memory usage is very low.
Mr. Fiber
Sep 7, 2015, 1:43:41 AM9/7/15
to Fluentd Google Group
From your image, 16:04:55 consumes CPU so it read lots of logs.
Maybe following command.
$ cat somelargefile >> offerwall.20.restore.2nd.log
(somelargefile's size is near 200MB)
You can check buffer status via in_monitor_agent and
Ruby's object allocations via in_object_space.
Comparing these metrics, you can investigate the problem deeply.
For example, what objects are not GCed.
--
Reply all
Reply to author
Forward
0 new messages