fill color above different from below line
55 views
Skip to first unread message

Robert Newton
Mar 5, 2015, 11:13:57 AM3/5/15
to flot-...@googlegroups.com
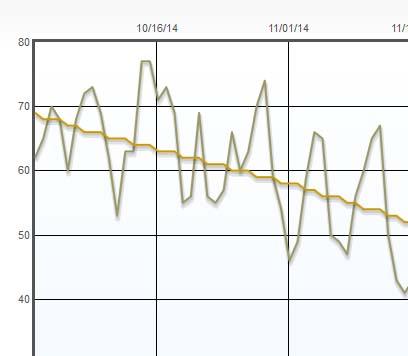
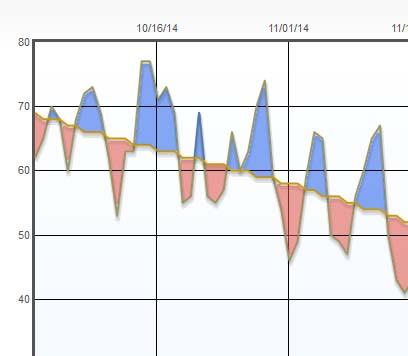
I have a graph with 4 xy scatter lines and want to know how to (if possible) to link a color to 2 of the lines (two pair). Further explanation, one line varies about another line (which is not flat but is one of the scatter lines), when the first line goes above the other line, I want the fill color to be one color, but when the first line dips below the other line, I want it to be a different color. Even though the graph is very easy for me to understand and appreciate (love FLOT), I think the different color fills would help others to grasp the meaning of the data more easily. I've attached 2 images as before and after examples (the after being photshopped).
Thanks!
Thanks!

Rob Lange
Mar 11, 2015, 3:44:19 PM3/11/15
to flot-...@googlegroups.com
Reply all
Reply to author
Forward
0 new messages