Use of Tree to make heatmap
1,675 views
Skip to first unread message

Asma Riyaz
Feb 6, 2014, 12:49:19 PM2/6/14
to eteto...@googlegroups.com
Hi
I am trying to make a phylogenetic tree appear next to a heat map. The tree I have generated is a numerical one and when I converted it to a Newick format this is what I get:
(((5:0,(8:0,(9:0,(11:0,(12:0,(13:0,(14:0,(15:0,(16:0,(17:0,(18:0,(19:0,(20:0,(21:0,(22:0,(23:0,24:0)1:0)1:0)1:0)1:0)1:0)1:0)1:0)1:0)1:0)1:0)1:0)1:0)1:0)1:0)1:0)1:0.583095,(0:0,(1:0,(2:0,(3:0,(4:0,(6:0,(7:0,10:0)1:0)1:0)1:0)1:0)1:0)1:0)1:0.583095)1:2.03532,((27:0,(28:0,(31:0,(32:0,33:0)1:0)1:0)1:0)1:0.583095,(25:0,(26:0,(29:0,30:0)1:0)1:0)1:0.583095)1:2.03532);
rather than this format:
((P01892_1A02_HUMAN365,(P30443_1A01_HUMAN365,P04439_1A03_HUMAN365)),((P62258_1433E_HUMAN255,P27348_1433T_HUMAN245),(P31947_1433S_HUMAN248,((P31946_1433B_HUMAN246,P63104_1433Z_HUMAN245),(Q04917_1433F_HUMAN246,P61981_1433G_HUMAN247)))));
In Node Faces in the tutorial it says:
tree.add_face(ProfileFace(20, 1, 3, width=200, height=40, style='lines', colorscheme=2),column=0,position="branch-right")
The error:AttributeError: 'TreeNode' object has no attribute 'profile'
The ETE related function written in mod.py is called:clusT_eteTree()
Appreciate your help in advance!!
I am trying to make a phylogenetic tree appear next to a heat map. The tree I have generated is a numerical one and when I converted it to a Newick format this is what I get:
(((5:0,(8:0,(9:0,(11:0,(12:0,(13:0,(14:0,(15:0,(16:0,(17:0,(18:0,(19:0,(20:0,(21:0,(22:0,(23:0,24:0)1:0)1:0)1:0)1:0)1:0)1:0)1:0)1:0)1:0)1:0)1:0)1:0)1:0)1:0)1:0)1:0.583095,(0:0,(1:0,(2:0,(3:0,(4:0,(6:0,(7:0,10:0)1:0)1:0)1:0)1:0)1:0)1:0)1:0.583095)1:2.03532,((27:0,(28:0,(31:0,(32:0,33:0)1:0)1:0)1:0)1:0.583095,(25:0,(26:0,(29:0,30:0)1:0)1:0)1:0.583095)1:2.03532);
rather than this format:
((P01892_1A02_HUMAN365,(P30443_1A01_HUMAN365,P04439_1A03_HUMAN365)),((P62258_1433E_HUMAN255,P27348_1433T_HUMAN245),(P31947_1433S_HUMAN248,((P31946_1433B_HUMAN246,P63104_1433Z_HUMAN245),(Q04917_1433F_HUMAN246,P61981_1433G_HUMAN247)))));
In Node Faces in the tutorial it says:
""Node faces are small pieces of graphical information that can be linked to nodes. For instance, text labels or external images could be linked to nodes and they will be plotted within the tree image.
Several types of node faces are provided by the main ete2 module, ranging from simple text (TextFace) and geometric shapes (CircleFace), to molecular sequence representations (SequenceFace), heatmaps and profile plots (ProfileFace). A complete list of available faces can be found at the ete2.treeview reference page..""
which is why I wrote this piece in my code:tree.add_face(ProfileFace(20, 1, 3, width=200, height=40, style='lines', colorscheme=2),column=0,position="branch-right")
The error:AttributeError: 'TreeNode' object has no attribute 'profile'
The ETE related function written in mod.py is called:clusT_eteTree()
Appreciate your help in advance!!

Jaime Huerta Cepas
Feb 6, 2014, 1:10:55 PM2/6/14
to eteto...@googlegroups.com
You just need to add the profile and deviation vector to each leaf node:
from ete2 import Tree, ProfileFace
import random
newick = "(((5:0,(8:0,(9:0,(11:0,(12:0,(13:0,(14:0,(15:0,(16:0,(17:0,(18:0,(19:0,(20:0,(21:0,(22:0,(23:0,24:0)1:0)1:0)1:0)1:0)1:0)1:0)1:0)1:0)1:0)1:0)1:0)1:0)1:0)1:0)1:0)1:0.583095,(0:0,(1:0,(2:0,(3:0,(4:0,(6:0,(7:0,10:0)1:0)1:0)1:0)1:0)1:0)1:0)1:0.583095)1:2.03532,((27:0,(28:0,(31:0,(32:0,33:0)1:0)1:0)1:0)1:0.583095,(25:0,(26:0,(29:0,30:0)1:0)1:0)1:0.583095)1:2.03532);"
root = Tree(newick)
# Once you have your tree loaded, you need to associate matrix vectors to the tip nodes
for lf in root.iter_leaves():
# Each leaf node must have a profile and a deviation vector, which will be based on your source matrix of values
lf.add_features(profile = [random.random() for x in xrange(10)])
# if no std deviation for the vector values, just use 0
lf.add_features(deviation = [0 for x in xrange(10)])
# Add a ProfileFace to each leaf node (you probably want aligned position). Choose among the following types.
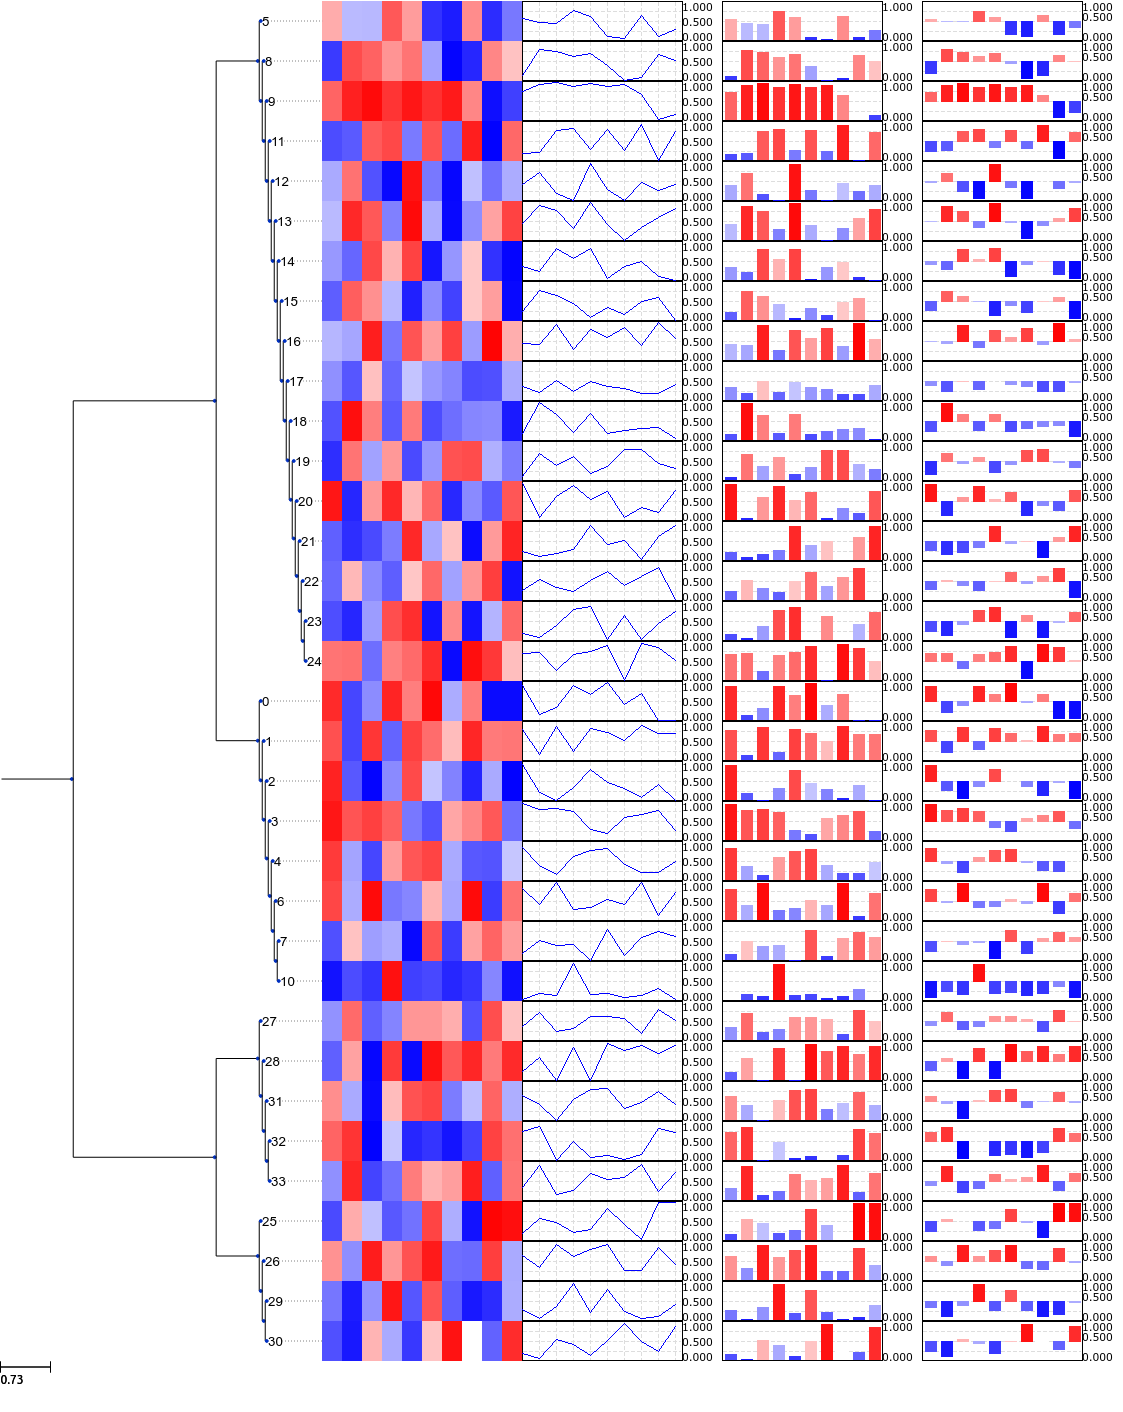
lf.add_face(ProfileFace(max_v=1, min_v=0.0, center_v=0.5, width=200, height=40, style='heatmap', colorscheme=2), column=0, position="aligned")
lf.add_face(ProfileFace(max_v=1, min_v=0.0, center_v=0.5, width=200, height=40, style='lines', colorscheme=2), column=1, position="aligned")
lf.add_face(ProfileFace(max_v=1, min_v=0.0, center_v=0.5, width=200, height=40, style='bars', colorscheme=2), column=2, position="aligned")
lf.add_face(ProfileFace(max_v=1, min_v=0.0, center_v=0.5, width=200, height=40, style='cbars', colorscheme=2), column=3, position="aligned")
root.render('mod.png')
cheers,
jaime
--
You received this message because you are subscribed to the Google Groups "The ETE toolkit" group.
To unsubscribe from this group and stop receiving emails from it, send an email to etetoolkit+...@googlegroups.com.
To post to this group, send email to eteto...@googlegroups.com.
Visit this group at http://groups.google.com/group/etetoolkit.
For more options, visit https://groups.google.com/groups/opt_out.
Asma Riyaz
Feb 6, 2014, 3:46:03 PM2/6/14
to eteto...@googlegroups.com
Thank you for your quick response, I am trying what you gave me.
Also I was wondering is there a possibility to combine previously made heat map (which I had done with matplotlib) with a phylogenetic tree that is produced in ETE?
Also I was wondering is there a possibility to combine previously made heat map (which I had done with matplotlib) with a phylogenetic tree that is produced in ETE?
Asma Riyaz
Feb 10, 2014, 9:47:35 AM2/10/14
to eteto...@googlegroups.com, hue...@embl.de
I have used the guidelines you gave me in your mail and this is what I did to add features and deviation:
for lf in tree.iter_leaves():
for sub_list in full_mapped_floats:
lf.add_features(profile = [ele for ele in sub_list])
lf.add_features(deviation = [0 for ele in sub_list])
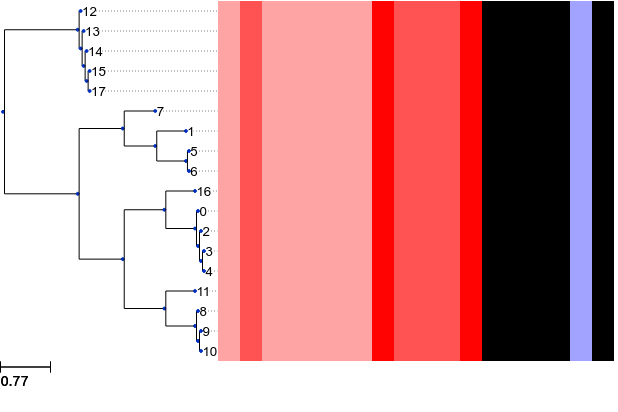
lf.add_face(ProfileFace(max_v=1, min_v=0.0, center_v=0.5, width=400, height=20, style='heatmap', colorscheme=2),column=1,position="aligned")
tree.show()
tree.render("heatmap_phylo.png")
The structure of full_mapped_floats is a list of lists.
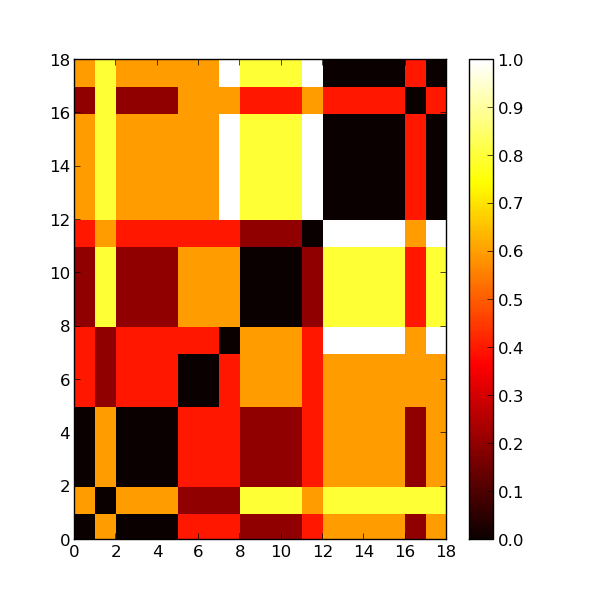
The heatmap generated looks odd when compared to the heatmap generated through matplotlib.
Is there something wrong with the way I put my data in?
Thank you!!
for lf in tree.iter_leaves():
for sub_list in full_mapped_floats:
lf.add_features(profile = [ele for ele in sub_list])
lf.add_features(deviation = [0 for ele in sub_list])
lf.add_face(ProfileFace(max_v=1, min_v=0.0, center_v=0.5, width=400, height=20, style='heatmap', colorscheme=2),column=1,position="aligned")
tree.show()
tree.render("heatmap_phylo.png")
The structure of full_mapped_floats is a list of lists.
| [[0 | 0.6 | 0 | 0 | 0 | 0.4 | 0.4] |
| [0.6 | 0 | 0.6 | 0.6 | 0.6 | 0.2 | 0.2] |
| [0 | 0.6 | 0 | 0 | 0 | 0.4 | 0.4] |
| [0 | 0.6 | 0 | 0 | 0 | 0.4 | 0.4] |
| [0 | 0.6 | 0 | 0 | 0 | 0.4 | 0.4]] |
The heatmap generated looks odd when compared to the heatmap generated through matplotlib.
Is there something wrong with the way I put my data in?
Thank you!!
Jaime Huerta Cepas
Feb 10, 2014, 10:00:41 AM2/10/14
to eteto...@googlegroups.com
look at your code carefully. You are assigning the same profile to all tips...
for lf in tree.iter_leaves():
for sub_list in full_mapped_floats: <--------------- You should remove this loop. Just add the correct profile vector to each tip using a tipname->matrix_row link or similar thing
lf.add_features(profile = [ele for ele in sub_list])
lf.add_features(deviation = [0 for ele in sub_list])
================================================
Jaime Huerta-Cepas, Ph.D.
Structural and Computational Biology Unit
EMBL Heidelberg
Meyerhofstraße 1, 69117 Heidelberg, Germany
http://www.bork.embl.de/~huerta/
================================================
Jaime Huerta-Cepas, Ph.D.
Structural and Computational Biology Unit
EMBL Heidelberg
Meyerhofstraße 1, 69117 Heidelberg, Germany
http://www.bork.embl.de/~huerta/
================================================
Asma Riyaz
Feb 10, 2014, 10:48:02 AM2/10/14
to eteto...@googlegroups.com, hue...@embl.de
Does tip name== name of leaf?
Asma Riyaz
Feb 10, 2014, 10:57:14 AM2/10/14
to eteto...@googlegroups.com, hue...@embl.de
Ok i got it, it should have been..
i=0
for lf in tree.iter_leaves():
lf.add_features(profile=[ele for ele in full_mapped_floats[i]])
lf.add_features(deviation = [0 for ele in full_mapped_floats[i]])
lf.add_face(ProfileFace(max_v=1.0, min_v=0.0, center_v=0.5, width=400, height=20, style='heatmap', colorscheme=2),column=1,position="aligned")
i=i+1
tree.show()
tree.render("heatmap_phylo.png")
Gives me a similar heat map. However the black boxes that are in left (slant) direction have turned right (slant). Is it because of the phylogenetic tree which was missing in the previous heat map (matplotlib)?
Jaime Huerta Cepas
Feb 10, 2014, 11:44:24 AM2/10/14
to eteto...@googlegroups.com
careful with the leaf profile mapping. The order of leaf iteration may not be the same as the one in your matrix (as you are assuming iin your code). Use the name of the leaves to correctly map the vectors. It looks also you that you have reversed the column order as compared with matplotlib.
================================================
Jaime Huerta-Cepas, Ph.D.
Structural and Computational Biology Unit
EMBL Heidelberg
Meyerhofstraße 1, 69117 Heidelberg, Germany
http://www.bork.embl.de/~huerta/
================================================
Jaime Huerta-Cepas, Ph.D.
Structural and Computational Biology Unit
EMBL Heidelberg
Meyerhofstraße 1, 69117 Heidelberg, Germany
http://www.bork.embl.de/~huerta/
================================================
Asma Riyaz
Feb 10, 2014, 2:36:37 PM2/10/14
to eteto...@googlegroups.com, hue...@embl.de
This time I searched according to the name of leaf nodes,
Since the newick file that was built had no organism names, I made a dictionary of this structure:
d={0:[1,2,3,4],1:[2,3,4,5],2:[3,4,5,6]}
While iterating through the leaves, I stored the name of the leaf, extracted the value in d corresponding to the key== leaf name,
for lf in tree.iter_leaves():
org_full_mapped_floats=[]
leaf_name=lf.get_leaf_names(is_leaf_fn=None)
print leaf_name
key=int(leaf_name[0])
org_full_mapped_floats=d[key]
lf.add_features(profile=[ele for ele in org_full_mapped_floats])
lf.add_features(deviation = [0 for ele in org_full_mapped_floats])
lf.add_face(ProfileFace(max_v=1.0, min_v=0.0, center_v=0.5, width=400, height=20, style='heatmap', colorscheme=2),column=1,position="aligned")
tree.show()
tree.render("heatmap_phylo.png")
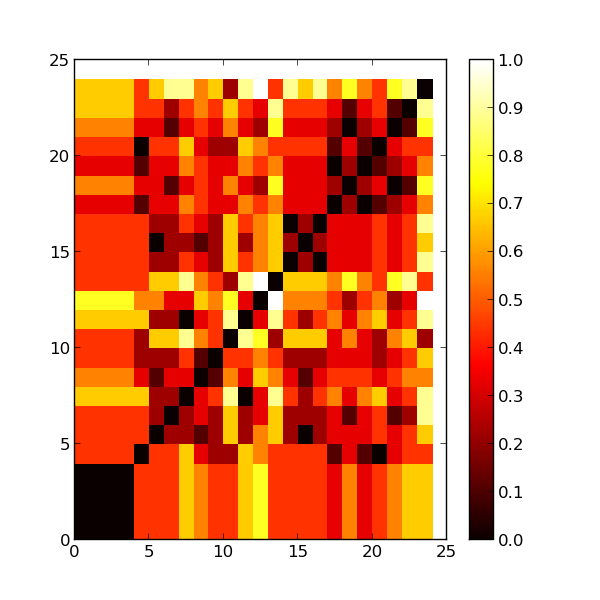
Is this the right way for mapping names of leaves to vectors? If yes, then why is the heat map generated look different from the matplotlib? Is it because of the tree construction?
Also I am using the same file for matplotlib and ETE so I don't think there is a reversal
tree.render("heatmap_phylo.png")
Is this the right way for mapping names of leaves to vectors? If yes, then why is the heat map generated look different from the matplotlib? Is it because of the tree construction?
Also I am using the same file for matplotlib and ETE so I don't think there is a reversal
Asma Riyaz
Feb 11, 2014, 1:40:32 PM2/11/14
to eteto...@googlegroups.com, hue...@embl.de
is there a color scale option to ETE for heat map?
Jaime Huerta Cepas
Feb 11, 2014, 2:03:37 PM2/11/14
to eteto...@googlegroups.com
there are 3 color schemes available, but they are hardcoded. You could also use the trick published here https://groups.google.com/d/msg/etetoolkit/_3adcV-rBec/TT9dfodkd1EJ to create your own color gradients.
It's normal that your matplotlib heatmap looks different, vectors in the tree are sorted according to their similarity. That's the whole point of a clustering analysis, but I am afraid that the interpretation of results goes beyond the scope and purpose of this list :)
cheers,
jaime
Asma Riyaz
Feb 11, 2014, 2:27:24 PM2/11/14
to eteto...@googlegroups.com, hue...@embl.de
I am sorry but I did "not" intend to ask for an interpretation, I only wanted to know if there is a difference between the heat map produced by matplotlib and ETE but I have figured that out. Thanks!!
I am using the trick that you mentioned for getting the color schemes for heatmap which works just fine.
When I meant color scale was: I want the vertical color scale bar which appears on the right side of the heat map which I made in matplotlib and if there is an alternative for the same?
I am using the trick that you mentioned for getting the color schemes for heatmap which works just fine.
When I meant color scale was: I want the vertical color scale bar which appears on the right side of the heat map which I made in matplotlib and if there is an alternative for the same?
Jaime Huerta Cepas
Feb 11, 2014, 3:34:40 PM2/11/14
to eteto...@googlegroups.com
I am sorry but I did "not" intend to ask for an interpretation, I only wanted to know if there is a difference between the heat map produced by matplotlib and ETE but I have figured that out. Thanks!!
No problem. As I said, yes, both heatmaps are suppose to look different, depending how your tree is sorting the leaves.
I am using the trick that you mentioned for getting the color schemes for heatmap which works just fine.
great
When I meant color scale was: I want the vertical color scale bar which appears on the right side of the heat map which I made in matplotlib and if there is an alternative for the same?
No, that's not possible. Sorry
On Tuesday, February 11, 2014 2:03:37 PM UTC-5, Jaime Huerta Cepas wrote:there are 3 color schemes available, but they are hardcoded. You could also use the trick published here https://groups.google.com/d/msg/etetoolkit/_3adcV-rBec/TT9dfodkd1EJ to create your own color gradients.It's normal that your matplotlib heatmap looks different, vectors in the tree are sorted according to their similarity. That's the whole point of a clustering analysis, but I am afraid that the interpretation of results goes beyond the scope and purpose of this list :)cheers,jaime

ryne...@gmail.com
Mar 20, 2016, 4:25:36 AM3/20/16
to The ETE toolkit, hue...@embl.de
Hey!
I've been struggling to build a similar plot using clustermap in seaborn :
https://stanford.edu/~mwaskom/software/seaborn/generated/seaborn.clustermap.html
I have a heatmap with two *different* phylogenetic trees on each axis, not unlike the first example in the clustermap documentation. The problem is that clustermap uses scipy.cluster.hierarchy.linkage, which cannot express phylogenetic trees -- unless your tree happens to be monotonic, strictly bifurcating and ultrametric. I wasted a bunch of time before I realized that my data can't meet those constraints.
How would you recommend going about this? I know that ete2 can do one tree with a heatmap for the tip faces, and I could perhaps order the columns by the other tree. I don't see how to draw both trees next to the heatmap simultaneously, though.
Another possibility might be to draw the trees in ete2 separately, and then use matplotlib to draw them (as separate artists, or perhaps as SVGs).
Any suggestions?
Russell
Reply all
Reply to author
Forward
0 new messages