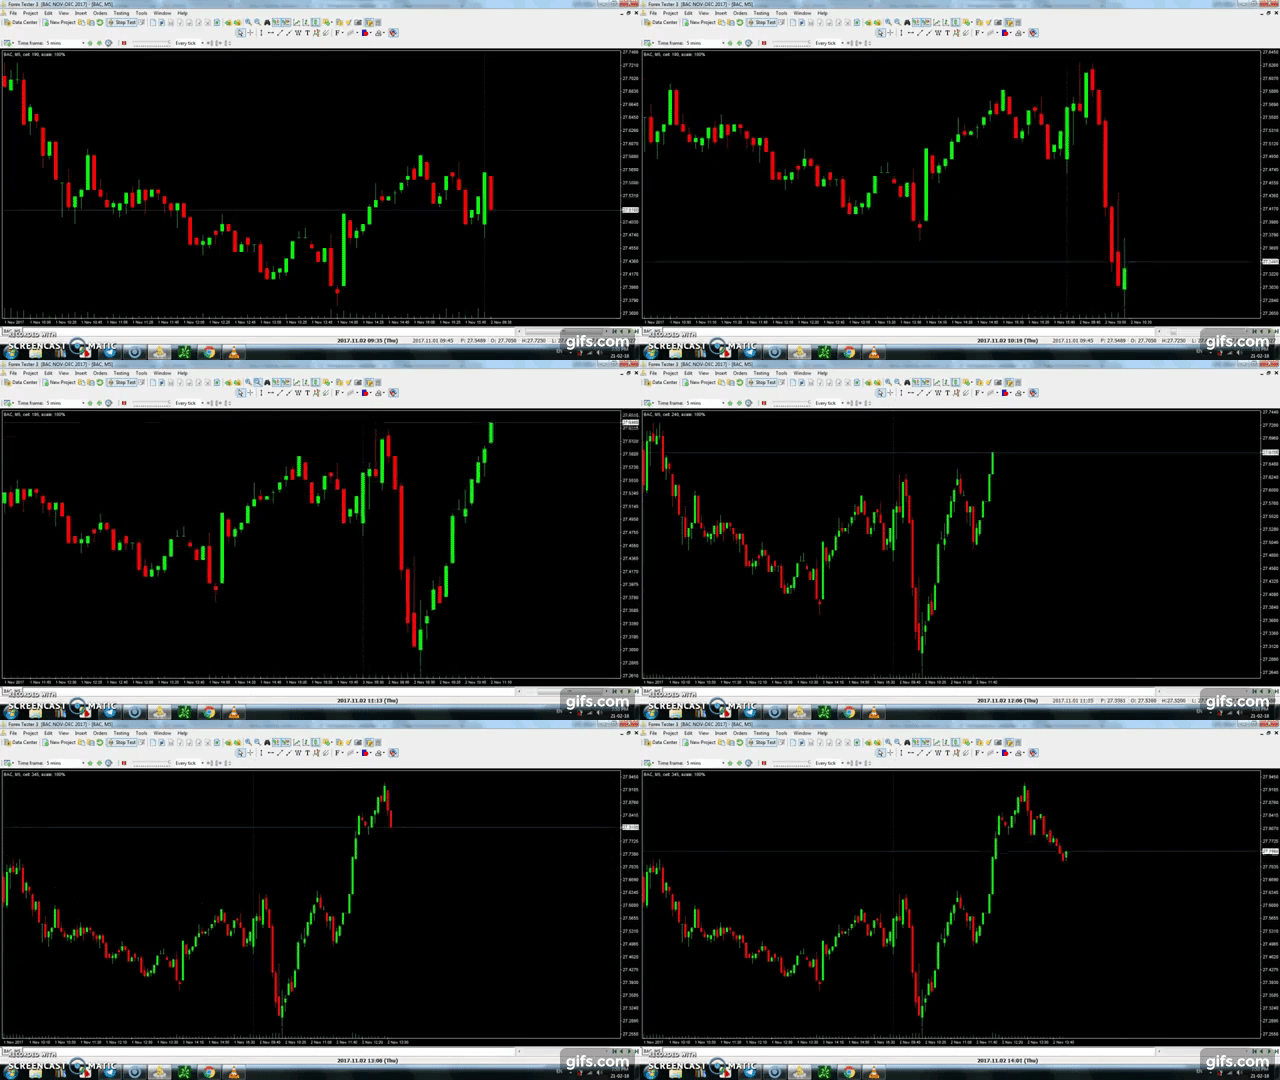
pausable, scrollable, dynamic stock charts simulator & visualizer in dygraphs?
Erjan G.
I want to make my own desktop stock simulator replay of historical stock price moves. I have a sample dataset of time-series price data available in CSV format. Essentially, I just need to render this data on canvas. The main point is to accumulate more trading experience in less time. A user can speed trade thru sessions for entire year in a week! I made a gif of another program made in Delphi(not open-source) to demonstrate the program I want to build. |
Should I use D3.js, chartist.js, highcharts, python, C++, electron.js or some other JS framework? Could u give me the direction or tool where I should be researching?
The task seems quite easy, after all it's just parsing dataset like above and showing it on screen with every new row drawing the price moves.
The high quality tick data shows change every milisecond, so it has more fields than just "open high low..", so i guess will need some milisecond clock counter to reflect every change in price.
The canvas should have :
- automatic scaling to fit in entire price range when price moves out of bounds of the canvas - all bars should adjust their size accordingly,
- zoom in\out
- scrollable chart - chart leaves past bars behind as the price prints new bars
- speed adjusting slider to slow down/increase the drawing speed
- I have made a somewhat working version in PURE js , no any libs, but it's not what I want


