Issue with Y axis labels on plots

Neotropical bat risk assessments
Eons ago (~2007) Hadley Wickham extremely generously helped me developed a means for plotting temporal activity w/ ggplot.
I need to revisit this and have it working again. I failed to copy the entire legacy code over to my traveling laptop from my workstation, but found a partial bit of the code in an old 2009 Gmail attachment. I am slated to do a graduate seminar at UF G'ville and needed to discuss temporal activity.
I have been working my feeble brain again and revisiting the almost complete code and have it partially working by doing step by step sections of code and carefully making sure no typos that could screw up syntax.
The partial code Hadley developed for me is below and is now working more or less with R 3.4.3 (2017-11-30).
What I need to do is have the missing bit of code so that the Y- Axis of the plots has time of night rather than the "elapsed seconds."
As a note this is for bat activity data so data points begin after sunset on a given night and end at sunrise the following day so date/times span 2 calender days with a midnight roll-over.
The code below was provided by Hadley and works except for the Y axis labeling with correct times.
I can email a sample of the raw data if anyone is able to help.
Cheers,
Bruce
++++++++++++++++++++++
library(zoo)
library(cluster)
library(lattice)
library(vegan)
library(chron)
library(MASS)
library(ggplot2)
# activity plots that Hadley Wickham helped develop back in
~2007
#New from Hadley
setwd("C:/Bats/Temporal
data")
#C:\Bats\Temporal
data
source("date.r")
All <- read.csv("C:/Bats/Temporal data/TECTemporal.CSV")
Ptepar
<-subset(All, Species == "Ptepar")
str(Ptepar)
# Notice that date and time are factors - you need to convert
them
# into dates. This doesn't happen automatically in R. Also,
the syntax to
# make dates isn't exactly intuitive.
Ptepar$Date <- as.Date(Ptepar$Date,
"%m/%d/%Y")
Ptepar$datetime <- as.POSIXct(strptime(paste(Ptepar$Date, format(Ptepar$Time,
"%H:%M")), "%Y-%m-%d %H:%M"))
# For a given time, give the time the evening started
# (this will be the previous day if the time is in the morning)
evening <- function(date) {
update(date,
yday = yday(date) - ifelse(am(date), 1, 0),
hour = 18,
minute = 0,
second = 0)
}
# Now we calculate the number of seconds since the start of the evening
Ptepar$elapsed <- as.double(Ptepar$datetime - evening(Ptepar$datetime), "secs")
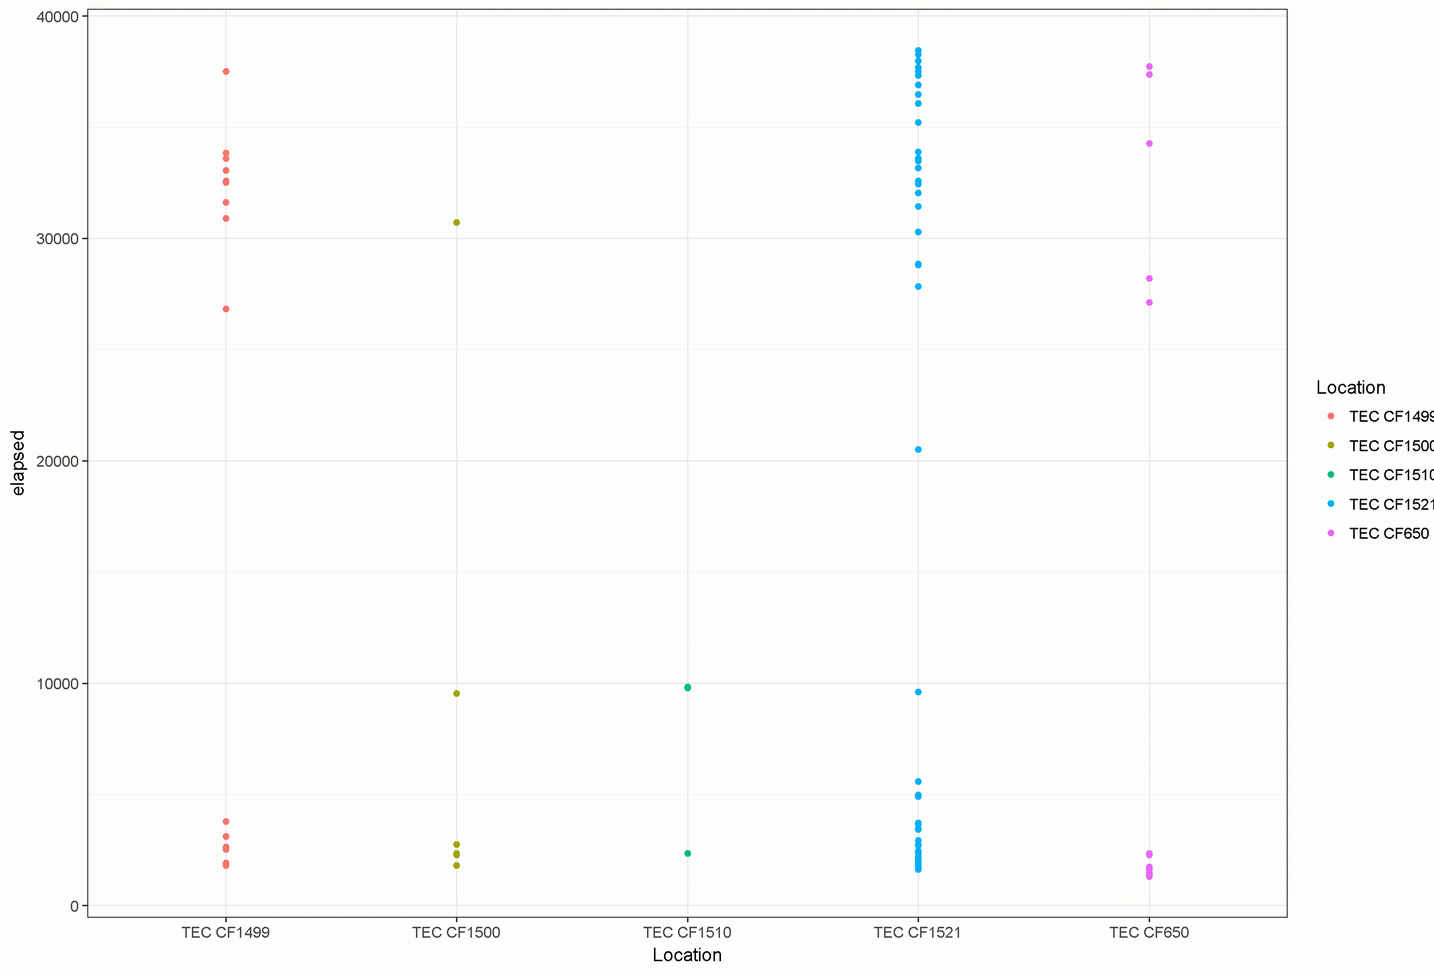
ggplot(Ptepar, aes(Date, elapsed, colour = Location)) +
geom_jitter() +
facet_wrap(~ Species)
The resulting plot appears fine however I need to have the Y axis display time of night rather than the elapsed seconds.
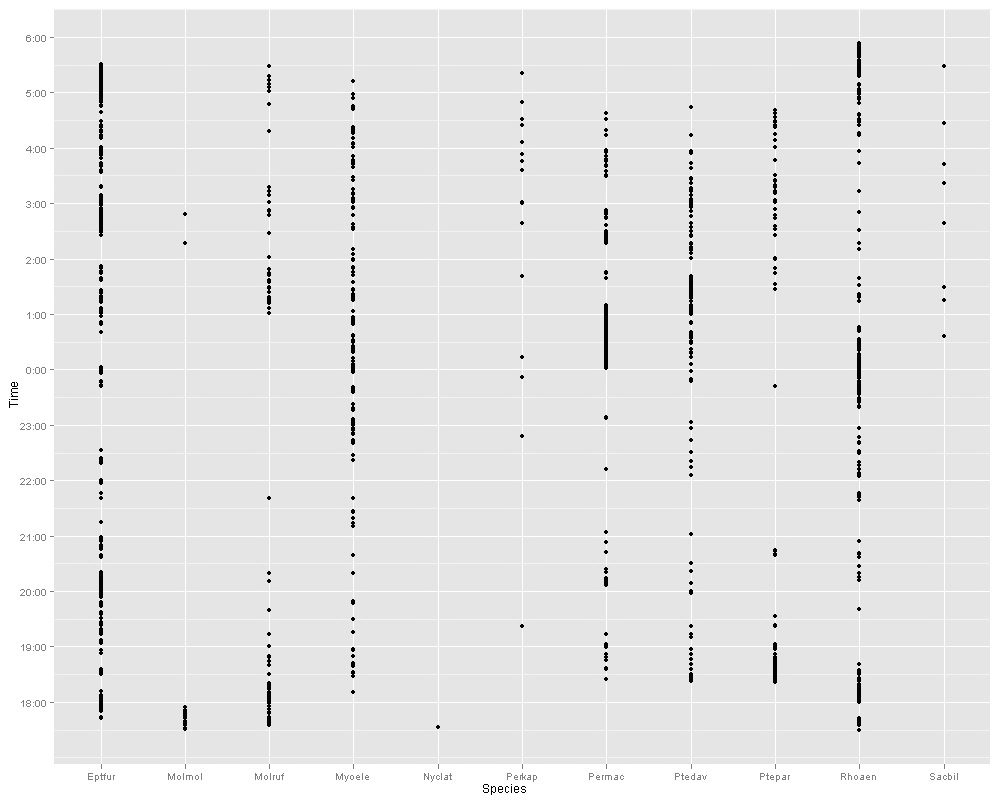
as in the second plot example below.
This is what is needed time on Y axis

Tom Hopper
<Ptepar_Plot.png>
This is what is needed time on Y axis
<Temporal activity plot.jpg>
--
---
You received this message because you are subscribed to the Google Groups "Deducer" group.
To unsubscribe from this group and stop receiving emails from it, send an email to deducer+u...@googlegroups.com.
For more options, visit https://groups.google.com/d/optout.