Spss import tip, requesting advice on the use of ordinal paired data--using such data with the Wilcoxon signed rank test, displaying on a 'grouped' bar chart and transferring plots to other documents (e.g Word)
9 views
Skip to first unread message

Mike
Oct 10, 2016, 11:20:47 AM10/10/16
to Deducer
Hello,
I am new to Deducer and love it! I'm a novice clinical researcher and just started learning R as a more feasible alternative for me to SPSS or other paid stats software. I first used Rstudio and the Radiant GUI and Deducer looks like it will work out much better for my needs. I am working on an iMac OSX 10.9.5
I have, and will be working in the future with a lot of paired ordinal data (developmental scales of students collected at different points in their school years). I therefore needed to import an old SPSS file into Deducer; but the file wouldn't load with the 'open' icon--I needed to manually entered the 'read.spss' command into JGR. I'm not sure if it matters, but it looks like Deducer tried to load the file from the desktop with single quotes around the filename; I got it to load with double quotes.
As for my requests:
1. Do you recommend changing paired ordinal data back into 'numerical' data to run the Wilcoxon signed rank test? From what I read, the Wilcoxon test is appropriate for paired ordinal data, but the standard Wilcoxon test in R only accepts numerical data (and not 'factor' 'ordered' data). SPSS allow one to keep the data as 'ordinal' when running such non-parametric tests. It's easy enough with deducer to go to the 'variable' view in the data viewer and change the variable type, but I worry that if I keep the variable as 'numerical', R might not warn me if I try and run other analyses that are not meant for 'ordinal' variables.
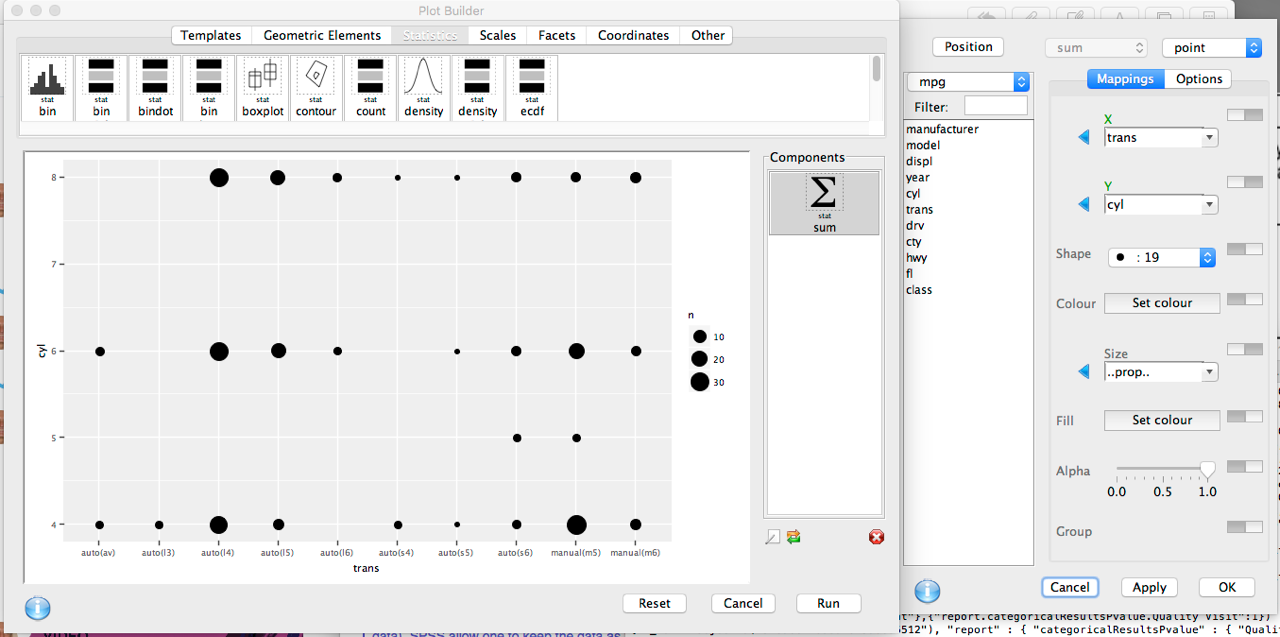
2. Since the data are ordinal, I thought it would be nice to compare the ordinal distributions of my paired data side by side using a 'grouped' bar chart (i.e. side by side bars contrasting the counts of students achieving a given development level when they start school vs when they finish):
4 X
3 X X
2 X
1 X X
Cnt
Dev. Lvl I (Frsh) (Sr) II (Frsh) (Sr) III (Frsh (Sr)
However, it doesn't look like the standard plotting functions are set up to plot two X variables on one graph. If I still wanted to do this, it looks like I might need to extract data from my current data set to perhaps combine Frsh + Sr developmental levels into one 'developmental' level variable and then make a new column/variable and label it 'school year' and then plot the one 'x' variable (developmental level) 'by' the new 'school year' variable. Is that the usual strategy one does to try and graph paired data on one bar chart or is there a simpler way?
3. Finally, unlike the Radiant GUI, I couldn't tell how to get the nice plots deducer/R produces copied into a Word or other document to share (or future publish) with other colleagues. I guess I could take a limited 'screenshot' picture and paste that, but wondered if I was missing an easier way to copy the plots.
I appreciate any advice the community can provide.
Thanks for the great software!
Sincerely,
Mike

Ian Fellows
Oct 11, 2016, 6:11:32 PM10/11/16
to ded...@googlegroups.com
Hi Mike,
Thanks for your input. I’m glad you are finding Deducer useful.
Regarding your requests:
1. Yes, I’d recommend working with them in a numeric coding. Rank based tests such as the ones mentioned are meant for both ordinal and numeric outcomes. In general, ordinal analyses in R are performed on numeric variables.
2. One way that I like doing this visualization is with a bubble chart (is that the right name?).
3. When you run a plot, there is a menu in the JavaGD window allowing you to save in your preferred format (png, pdf, …)
Best,
Ian
--
---
You received this message because you are subscribed to the Google Groups "Deducer" group.
To unsubscribe from this group and stop receiving emails from it, send an email to deducer+u...@googlegroups.com.
For more options, visit https://groups.google.com/d/optout.
president.mvh...@gmail.com
Oct 14, 2016, 3:13:21 PM10/14/16
to Deducer, president.mvh...@gmail.com
Thanks, Ian!
P.S.
Do you have any recommendations for good R programming books for beginners to complement the use of Deducer?
Have a good week,
Mike
Reply all
Reply to author
Forward
0 new messages