negative values not stacking correctly on positive bars in a stacked ordinal bar chart
924 views
Skip to first unread message

Paul Young
Jun 8, 2013, 5:10:32 PM6/8/13
to dc-js-us...@googlegroups.com
Hi,
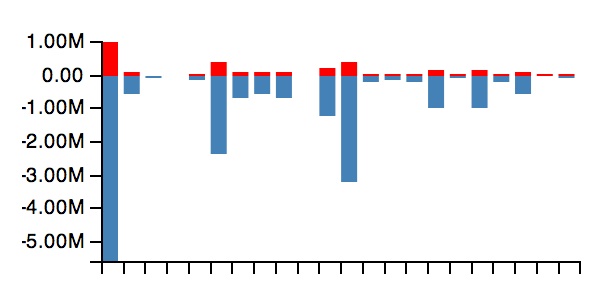
I am not sure if I am doing something wrong, hence I've not raised an issue but I am finding a rendering problem whenever I attempt to stack groups that have negative values on to bar charts that have existing groups with positive values. In these cases the stacked negative bar is not stack at the bottom i.e. from the zero y value downwards but instead appears over the top of the positive bar.
It looks like this:
Negative stacked on positive:

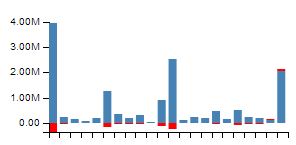
With the same code, just with the data filtered differently such that the .group() has negative values and the .stack() group has positive values then it renders correctly:
Positive stacked on negative:
It's this that makes me think it is a bug rather than a problem with my code. But could someone please see if they can reproduce this? or perhaps give me some suggestions where I might be going wrong.
I'm using the current stable 1.3 and my chart code looks like:
netPositionMTEbyAccountChart                .width(300)
                .height(200)
                .dimension(accountNetPositionDollarMTE)
                .group(accountNetPositionDollarMTEgroup)
                .stack(accountNetOrderDollarMTEgroup)
                .margins({ top: 10, left: 40, right: 10, bottom: 80 })
                .elasticY(true)
                .x(d3.scale.ordinal().domain(accountList))
                .xUnits(dc.units.ordinal)
                .renderlet(function (chart) {
                    chart.selectAll("g.x text")
                      .attr('dx', '-38')
                      .attr('dy', '0')
                      .attr('transform', "rotate(-90)");
                })
                .yAxis().tickFormat(d3.format(".3s"));
Thanks in advance ,
Paul

Nick Zhu
Jun 8, 2013, 6:24:19 PM6/8/13
to Paul Young, dc-js-us...@googlegroups.com
Hi Paul,
You are right stacking currently does not support stacking with mixed positive and negative values since I am not sure how stacked bars can be rendered effectively without confusing users in this case. I would venture to argue when your data set contain both negative as well as positive values then stacked bar chart is probably not the best visualization tool for that kind of data set. In this case I think side-by-side grouped bar chart is probably a better choice though dc.js does not support grouped bar chart neither (I know my answer is not very helpful in this case)
Cheers,
Nick
Paul Young
Jun 13, 2013, 1:05:03 PM6/13/13
to dc-js-us...@googlegroups.com, Paul Young
Hi Nick,
Thanks, you answer is very helpful! now I understand the situation I can try to work around it. I've had a few more thoughts - I would really like to hear your opinion on them....
I agree that stacking of multiple sets of mixed positive and negative values in general doesn't make much sense and is visually very confusing. Hence I totally understand why you'd not support it.
However, in this case I have a slightly different situation in which I'd argue might warrant stacking of a single set of mixed sign values...
What I want to indicate is the changes in the displayed values. Each of my points represent values at a point in time that have changed from a previous point in time. So in this case, I'm attempting to indicate this change by stacking a single set of positive and negative values in red. The second image I attached above shows what I'm trying to do and I think is ok. (It's similar to what people may have seen on some graphic equalizers on their music players). I've also experimented with groups bars as you suggest but that adds a lot of visual elements that are a lot smaller than the main ones. So it didn't really work either. I'd love to hear any other suggestions anyone may have.
Otherwise, I guess I'll have a stab patching the code so this work . It looks to me that the logic is all in the calculateDataPointMatrix() function and I'll try to make the if statement "symmetric" with regards to value sign for the (groupIndex==0) case - if you get my drift.(my first chart above would then look like a vertically flipped version of my second chart)
However, I'm far from sure that I'll be able to get this to work and test it properly and if I did I can't reasonably expect you to merge it in - so even this isn't ideal.
I guess my final alternative would be attempt to create my own d3 chart and to hook it up with dc - which would be even harder but then at least I could stick with the stable release and maintain my custom chart separately. Sorry if you've answered this elsewhere - but have you written any guidelines on how to extend dc.js with custom chart types?
Sorry to ask so many questions and thanks again for all your hard work.
Regards,
Paul.
Paul Young
Jun 14, 2013, 11:17:55 AM6/14/13
to dc-js-us...@googlegroups.com, Paul Young
Hi,
Well I have managed to get this to work by changing the else if clause in calculateDataPointMatrix() that checks for the stacking of negative values to add a check to see if the previous datapoint is greater or less than the base line. i.e.:
else if (value < 0)
     _groupStack.setDataPoint(groupIndex, dataIndex, _groupStack.getDataPoint(groupIndex - 1, dataIndex) + _chart.dataPointHeight(d, groupIndex - 1))
changes to:
else if (value < 0)
    if (_groupStack.getDataPoint(groupIndex - 1, dataIndex) > _chart.dataPointBaseline())
        _groupStack.setDataPoint(groupIndex, dataIndex, _groupStack.getDataPoint(groupIndex - 1, dataIndex) + _chart.dataPointHeight(d, groupIndex - 1));
    else
        _groupStack.setDataPoint(groupIndex, dataIndex, _chart.dataPointBaseline());
Then that seems to work, but I haven't attempted to test this works fine for all types of stacked chart. This then means that the first chart that I attached above now looks like:
Which I think makes more sense, but I'll leave it up to you to decide if it is just another kind of bad.
Thanks again for all your help.
Paul
Nick Zhu
Jun 14, 2013, 12:52:26 PM6/14/13
to Paul Young, dc-js-us...@googlegroups.com
Hi Paul,
I am glad you have found a solution to your problem. If you like feel free to fork dc.js and provide your chart as an additional add-on that people can use in their solution =) Anyway happy visualizing.
Cheers,
Nick

Igor Shchukin
Oct 10, 2016, 9:38:07 AM10/10/16
to dc-js user group, paul.v...@gmail.com
Hi Paul,
Regards,
I wonder is you ever migrated that change to dc.js 2.0? I have exactly the same problem.
Regards,
Igor
Reply all
Reply to author
Forward
0 new messages