overlaying violin plots by a grouped variable?

Myfanwy Johnston
Hi all,
I’ve hit a ggplot2 wall - I’m trying to add violin plots by a grouped variable (River kilometer), with a different independent variable on top of a base plot. I know this can get tricky with ggplot2 because secondary axes are verboten.
I’ve attached an .RData with a subset of my real dataframe, which is enormous. The test data look like:
load('test.Rdata)
x
Observations: 28,339
Variables: 9
$ DateTimeUTC (time) 2015-09-09 19:53:18, 2015-09-09 19:53:59, 2015-09-09 19:54:47, 2015-09-09 19:57:24, 2015-09-09...
$ TagID       (dbl) 37823, 37823, 37823, 37823, 37823, 37823, 37823, 37823, 37823, 37823, 37823, 37823, 37823, 3782...
$ Station     (chr) "Abv_rstr", "Abv_rstr", "Abv_rstr", "Abv_rstr", "Abv_rstr", "Abv_rstr", "Abv_rstr", "Abv_rstr",...
$ Rkm         (dbl) 121, 121, 121, 121, 121, 121, 121, 121, 121, 121, 121, 121, 121, 121, 121, 121, 121, 121, 121, ...
$ Sp          (chr) "chn", "chn", "chn", "chn", "chn", "chn", "chn", "chn", "chn", "chn", "chn", "chn", "chn", "chn...
$ julianday   (dbl) 252, 252, 252, 252, 252, 252, 252, 252, 252, 252, 252, 252, 252, 252, 252, 252, 252, 252, 252, ...
$ month       (dbl) 9, 9, 9, 9, 9, 9, 9, 9, 9, 9, 9, 9, 9, 9, 9, 9, 9, 9, 9, 9, 9, 9, 9, 9, 9, 9, 9, 9, 9, 9, 9, 9,...
$ year        (dbl) 2015, 2015, 2015, 2015, 2015, 2015, 2015, 2015, 2015, 2015, 2015, 2015, 2015, 2015, 2015, 2015,...
$ count       (int) 1, 1, 1, 1, 1, 1, 1, 1, 1, 1, 1, 1, 1, 1, 1, 1, 1, 1, 1, 1, 1, 1, 1, 1, 1, 1, 1, 1, 1, 1, 1, 1,...
Where each row of the dataframe is a detection from an individual fish. The last column, ‘count’, is the total number of different fish detected on that julian day. The following code gives me the following plot, where the different colors are the two different species of fish, and the points are individual detections across space (river kilometer, the y axis) and time (DateTimeUTC):
g <- ggplot(x, aes(x = DateTimeUTC, y = Rkm)) + geom_point(data = x, aes(color = factor(Sp)), alpha = 0.4, size = 0.5) + theme(legend.position = 'none') + scale_y_continuous(breaks = breaks, limits = c(100, 170))
g
What I would like to do is add individual violin plots for each river kilometer that show the change in the COUNT variable over time. In other words, I’d like the plot to not only show the detections across time, but how many individual fish those detections represent. Since I would essentially be mixing scales of the geometries, is there even a way to do this with ggplot2? I’ve been playing with it all morning but haven’t come up with a solution.
Thanks so much!
Myfanwy

Brandon Hurr
--
Check out our R resources at http://d-rug.github.io/
---
You received this message because you are subscribed to the Google Groups "Davis R Users' Group" group.
To unsubscribe from this group and stop receiving emails from it, send an email to davis-rug+...@googlegroups.com.
Visit this group at https://groups.google.com/group/davis-rug.
For more options, visit https://groups.google.com/d/optout.
Myfanwy Johnston
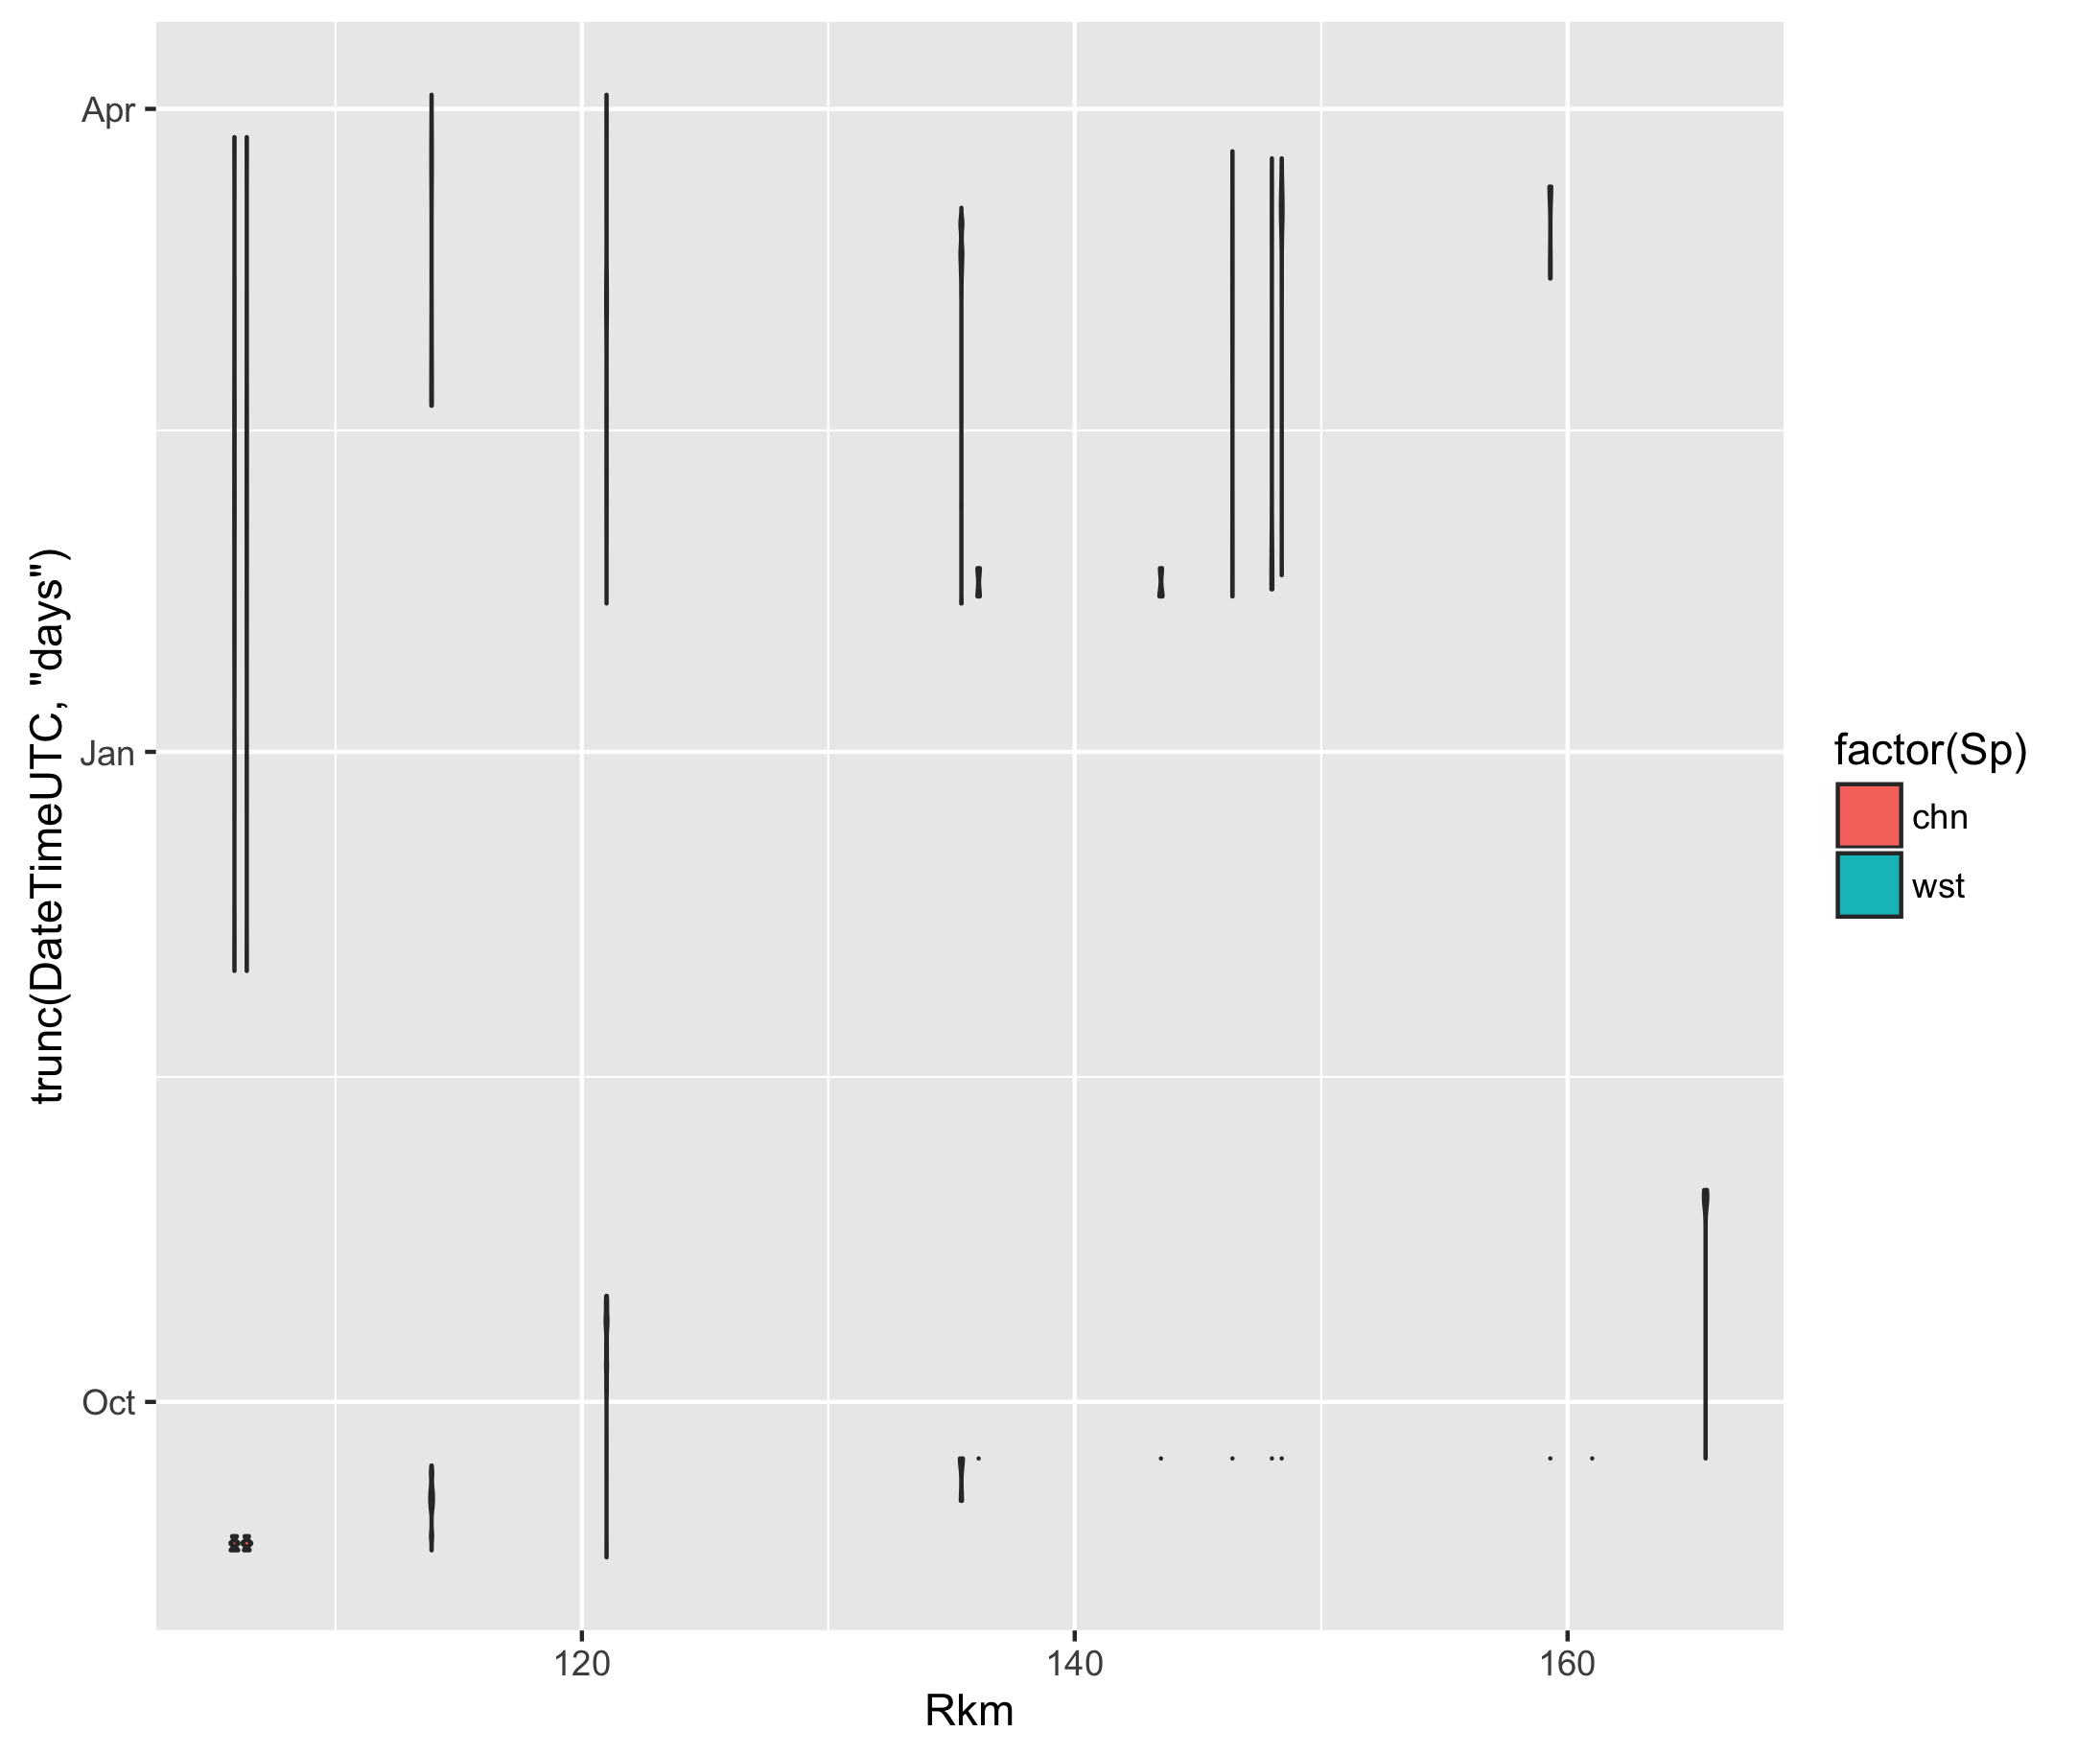
Myfanwy,I'm not sure if this is what you want or not, but perhaps this helps get there:ggplot(x, aes(x = Rkm, y = trunc(DateTimeUTC, "days"), fill = factor(Sp), group = interaction(Rkm,Sp))) + geom_violin(position = "identity")The resulting violins are extremely thin though. Doesn't show a whole lot at this scale. I trunc(ated) at day so they would clump together better and used group to clump things together. Then put the position right over the value in the chart.
HTH,


Matthew D Pagel
Can you normalize the COUNT field to the same scale? (or apply a log transform and then normalize?)
I was going to suggest you play with the opacity of the splotches, but a) I don't know if ggplot2 has alpha channel support for RGB values and b) that wouldn't address numbers of different individuals present, just the number of detections of all individuals (i.e. total detections) that day.
Would a bubble chart (e.g. http://www.highcharts.com/demo/bubble) suit your needs, or does a violin chart afford you something the bubble chart wouldn't? [note, linked URL has nothing to do with R...is only used for visual purposes]. One way I went with visualizing total and unique detections is on our development site at
http://sandbox5.metro.ucdavis.edu/memo/loadview
(then change Location to "YB_ToeDrain_Base" or one of other the 69KHz sites and select both checkboxes)
Note also that this development site will probably look drastically different early next week, so get a feel for it while it lasts!