italics on figure legend
4,530 views
Skip to first unread message

Rosemary Hartman
Mar 24, 2017, 11:17:59 AM3/24/17
to davi...@googlegroups.com
Hello all,
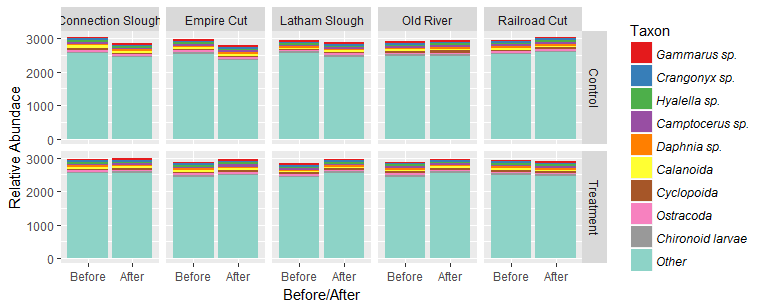
I am trying to make a stacked bar plot with colors for different invertebrate taxa using ggplot2. Some of the critters were IDed to genus or species, whereas others were lumped into higher classifications. Therefore, some of the labels should be in italics, and some shouldn't. I've tried to use the "legend.text" element in the "theme" function, but it only seems to be able to change the font of the entire legend, not specific elements in it. I'd like a plot similar to what I've copied below, but with only the first five labels in italics. I've copied my code and attached some fake data as an example.library(ggplot2)
#set up a figure with before/after on the s axis, CPUE on the y axis, colored by taxon
fig1 = ggplot(bugs3, aes(x=BA, y=CPUE, fill = tax))
# Make it faceted by control/treatment and location
fig1+ facet_grid(CT~Location) +
# it's a bar plot
geom_bar(stat = "identity", position = "stack") +
# fix the axis labels
xlab("Before/After") + ylab("Relative Abundace")+
#fix the fill labels. Can I make them italics at the same time? Not sure.
scale_fill_manual(name = "Taxon", labels = c("Gammarus sp.", "Crangonyx sp.", "Hyalella sp.", "Camptocerus sp.", "Daphnia sp.", "Calanoida", "Cyclopoida", "Ostracoda", "Chironoid larvae", "Other")) +
#try for italics. It only reads the first "face" statement.
theme(legend.text = element_text(face = c(rep("italic", 5), rep("plain", 5))))

Evan Eskew
Mar 24, 2017, 11:25:53 AM3/24/17
to davi...@googlegroups.com
Hi Rosie,
It wasn't using ggplot2, but I spent an inordinate amount of time trying to get a similar thing working recently. The solution ended up being specifying labels as a vector using "expression()". You can see my code here: https://github.com/eveskew/bayesian_snake_movement/blob/master/bayesian_snake_movement.R. Searching for "italic" should get you to the relevant code.
Hope it helps!
Best,
Evan
--
Check out our R resources at http://d-rug.github.io/
---
You received this message because you are subscribed to the Google Groups "Davis R Users' Group" group.
To unsubscribe from this group and stop receiving emails from it, send an email to davis-rug+unsubscribe@googlegroups.com.
Visit this group at https://groups.google.com/group/davis-rug.
For more options, visit https://groups.google.com/d/optout.
Rosemary Hartman
Mar 24, 2017, 11:39:20 AM3/24/17
to davi...@googlegroups.com
Thanks! Right after I sent this email I thought of checking the ggplot2 listserv, and found another solution, though it takes a little finagling
# set up a vector of labels as character strings with quotes around them (note the double quotes)
lab = c("'Gammarus sp'", "'Crangonyx sp'", "'Hyalella sp'", "'Camptocerus sp'", "'Daphnia sp'", "'Calanoida'", "'Cyclopoida'", "'Ostracoda'", "'Chironoid larvae'", "'Other'")
#now set up the graph
fig1+ facet_grid(CT~Location) +
geom_bar(stat = "identity", position = "stack") +
# parse the terms "italic" and "plain" before the labels
scale_fill_manual(name = "Taxon", labels = parse(text=c(paste('italic(',lab[1:5],')'),
paste('plain(',lab[-c(1:5)],')'))))
paste('plain(',lab[-c(1:5)],')'))))
Reply all
Reply to author
Forward
0 new messages