error in grobs using grid.arrange
1,289 views
Skip to first unread message

Corey Clatterbuck
Oct 19, 2017, 3:08:35 PM10/19/17
to Davis R Users' Group
Hi all,
I have some code that has worked previously but is now throwing an error. I have a layout (lay) and a vector of plots (hmm) that I am trying to arrange using grid.arrange:
lay <- rbind(c(1,1,2,2,3,3),
c(1,1,2,2,3,3),
c(4,4,5,5,6,6),
c(4,4,5,5,7,7))
hmm <- c(test3, test2, test1, test, test4, test5, test6)
grid.arrange(grobs = hmm, layout_matrix = lay)
Error in gtable_add_grob(gt, grobs, t = positions$t, b = positions$b, :
Not all inputs have either length 1 or same length same as 'grobs'
With grid.newpage () and jpeg() code between "lay" and "hmm", it used to produce this plot:

What does this error mean? Or, any idea for how to reproduce this plot?
Cheers,
Corey

John Mola
Oct 19, 2017, 3:35:50 PM10/19/17
to davi...@googlegroups.com
Hey Corey,
I've never actually worked with grid.arrange and am now sure what you meant by the grid.newpage() and jpeg() part...BUT...I tried figuring it out, quit, and then did this...
Maybe an unsatisfying answer (but it works for me in similar situations is this:
require(cowplot)
require(tidyverse)
test = ggplot(aes(Sepal.Length, Sepal.Width), data = iris) + geom_point()
test1 = ggplot(aes(Sepal.Length, Petal.Length), data = iris) + geom_point()
test2 = ggplot(aes(Sepal.Length, Petal.Width), data = iris) + geom_point()
test3 = ggplot(aes(Species, Sepal.Width), data = iris) + geom_boxplot()
test4 = ggplot(aes(Species, Sepal.Length), data = iris) + geom_boxplot()
test5 = ggplot(aes(Species, Petal.Length), data = iris) + geom_boxplot()
test6 = ggplot(aes(Species, Petal.Width), data = iris) + geom_boxplot()
t56 = plot_grid(test5,test6, ncol = 1)
plot_grid(test,test1,test2,test3,test4,t56, nrow=2,ncol=3)
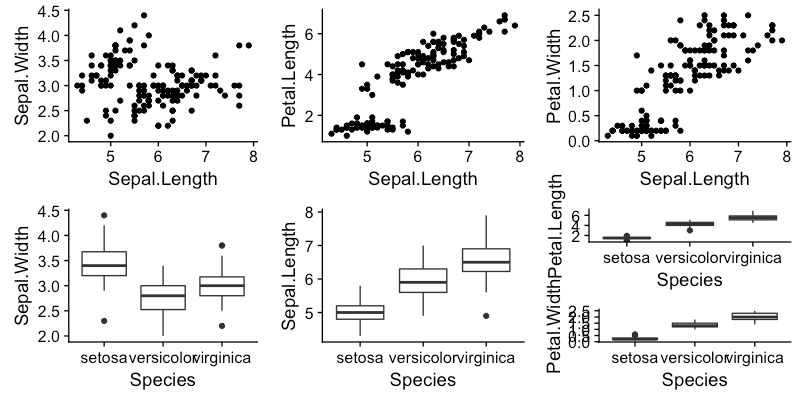
Which yields:
You can ignore the plot creation stuff, just needed dummy data. Basically, just put a plot_grid inside of a plot_grid in order to stack plots "test5" and "test6". Wasn't sure what order and whatnot ya had..but this does a thing that looks similar.
Hope that maybe helps.
Cheers,
John
--
Check out our R resources at http://d-rug.github.io/
---
You received this message because you are subscribed to the Google Groups "Davis R Users' Group" group.
To unsubscribe from this group and stop receiving emails from it, send an email to davis-rug+unsubscribe@googlegroups.com.
Visit this group at https://groups.google.com/group/davis-rug.
For more options, visit https://groups.google.com/d/optout.
Corey Clatterbuck
Oct 19, 2017, 6:28:25 PM10/19/17
to Davis R Users' Group
Yay, that worked and is way more intuitive than what I wrote. Thanks John!
To unsubscribe from this group and stop receiving emails from it, send an email to davis-rug+...@googlegroups.com.
Visit this group at https://groups.google.com/group/davis-rug.
For more options, visit https://groups.google.com/d/optout.
Corey Clatterbuck
Nov 29, 2017, 5:57:05 PM11/29/17
to Davis R Users' Group
Hey Mola,
Any idea how to add axis labels to plot_grid? The example you posted has axis labels for each plot, but I want a single, centered x and y-axis label. Looked through the plot_grid code and found add_sub as an option, which is good for the x-axis, but not for the y.
On Thursday, October 19, 2017 at 12:35:50 PM UTC-7, John Mola wrote:
To unsubscribe from this group and stop receiving emails from it, send an email to davis-rug+...@googlegroups.com.
Visit this group at https://groups.google.com/group/davis-rug.
For more options, visit https://groups.google.com/d/optout.
John Mola
Nov 29, 2017, 6:12:10 PM11/29/17
to davi...@googlegroups.com
Hey Corey,

I've done it previously by creating a plot that just has the axes/axes labels and then plot_grid with that. As far as I know, it'll take whatever you throw at it and align. So just make your grid of 6, and then nest a y-axis in its own plot on the left in another plot_grid. (i.e. plot_grid within a plot_grid within a plot_grid...) Hacky, but it works.
Others might chime in with their (better?) suggestions.
Cheers!
John
John
To unsubscribe from this group and stop receiving emails from it, send an email to davis-rug+unsubscribe@googlegroups.com.
Visit this group at https://groups.google.com/group/davis-rug.
For more options, visit https://groups.google.com/d/optout.

Joel Schwartz
Nov 30, 2017, 12:54:34 AM11/30/17
to Davis R Users' Group
Hi Corey,
I think the error you were getting was due to using grobs=c(test1, ...) rather than grobs=list(test1, ...) in grid.arrange. Here are a few examples using the built-in mtcars data frame:
Now we can plot them like this:
But if your plots are separate objects, you don't need to put them in a list. You can do either of the following instead:
However, if you can generate your plots with a function that outputs a list of plots (either by iterating over groups in a data frame or iterating similar plots over a list of data frames), then you may be able to do your plotting with less code. Here's a toy example as the plots below would be better generated as a single plot with faceting:
If your x and/or y axis variables are the same in each plot, then you can remove the x-axis and y-axis titles from the individual plots and substitute a single title for each axis like this:
Hope that helps.
Best Wishes,
Joel
I think the error you were getting was due to using grobs=c(test1, ...) rather than grobs=list(test1, ...) in grid.arrange. Here are a few examples using the built-in mtcars data frame:
# Create seven identical plots just for illustration
p1 = ggplot(mtcars, aes(wt, mpg)) +
    geom_point()
p2 = p3 = p4 = p5 = p6 = p7 = p1

# Put the plots in a list
plots = list(p1,p2,p3,p4,p5,p6,p7)
Now we can plot them like this:
grid.arrange(grobs=plots, layout_matrix=lay)But if your plots are separate objects, you don't need to put them in a list. You can do either of the following instead:
grid.arrange(p1,p2,p3,p4,p5,p6,p7, layout_matrix=lay)
grid.arrange(grobs=mget(paste0("p",1:7)), layout_matrix=lay)However, if you can generate your plots with a function that outputs a list of plots (either by iterating over groups in a data frame or iterating similar plots over a list of data frames), then you may be able to do your plotting with less code. Here's a toy example as the plots below would be better generated as a single plot with faceting:
plot.list = lapply(unique(mtcars$carb), function(group) {
  ggplot(mtcars[mtcars$carb==group, ], aes(wt, mpg)) +
    geom_point()
})
If your x and/or y axis variables are the same in each plot, then you can remove the x-axis and y-axis titles from the individual plots and substitute a single title for each axis like this:
grid.arrange(grobs=lapply(plot.list, function(p) {
  p + theme(axis.title=element_blank())
}), bottom="Weight", left="MPG", layout_matrix=lay)
Hope that helps.
Best Wishes,
Joel
Joel Schwartz
Nov 30, 2017, 3:32:03 PM11/30/17
to Davis R Users' Group
I forgot to mention in my previous response that you can also avoid the need for the layout matrix by nesting a call to arrangeGrob (which works like grid.arrange but returns a new grob without printing it). For example:
grid.arrange(grobs=c(plots[1:5], list(arrangeGrob(grobs=plots[6:7], ncol=1))), ncol=3)On Thursday, October 19, 2017 at 12:08:35 PM UTC-7, Corey Clatterbuck wrote:
Reply all
Reply to author
Forward
0 new messages