Rmd Presentation Leaflet map in Second Column
95 views
Skip to first unread message

Brandon Hurr
Nov 30, 2015, 7:01:40 PM11/30/15
to davi...@googlegroups.com, rap...@ucdavis.edu
After Ryan's presentation I thought I would try making my next presentation in Markdown. I've managed to do the base presentation, but now trying to be fancy (and failing).
I have a slide where I'm trying to show location of trials and it runs fine, but what I would like is to have a small map to the right and a column of bullets referring to those points on the left.
The leaflet map seems to force itself across the entire slide and leaves a gray box where I expect it to go: 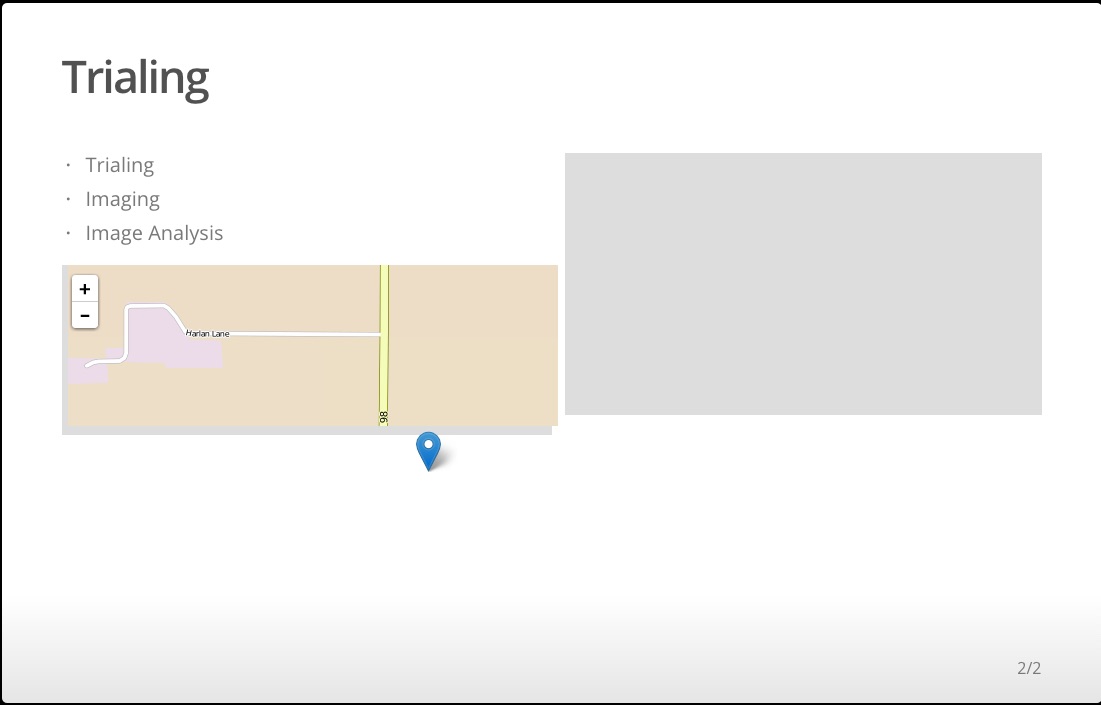
You can move the map from the gray box, but once you move, both boxes go gray. Seems like a bug, but I'm unsure.
I have attached an Rmd with the basics of what I'm trying to do. I can't seem to find anything (at all) about this.
Any ideas?
Thanks,
Brandon

Ryan Peek
Nov 30, 2015, 8:59:30 PM11/30/15
to Davis R Users' Group, rap...@ucdavis.edu
Hi Brandon,
You need to enclose your shiny bit in an "app" and then you it should work. I'll send something later that uses the leafletr package to build a stand-alone html map that you can then embed into your Rmd (and then print the whole thing to html, assuming you aren't needing shiny). It's kind of a slick way to have an interactive map in a stand-alone slide presentation/html (so you don't need R to run/open).
Anyway, code below should work:
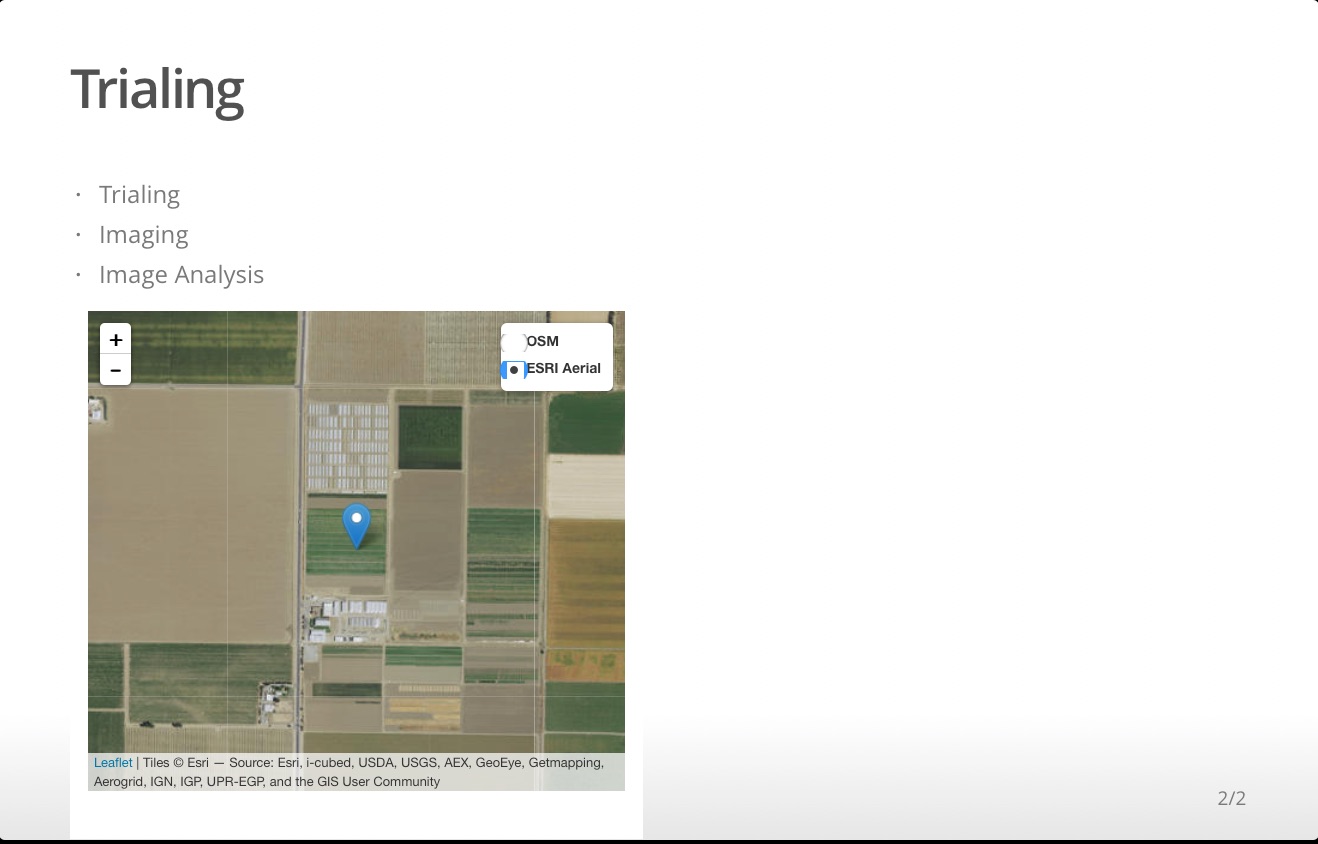
## Trialing {.columns-2}
- Trialing
- Imaging
- Image Analysis
```{r, eval=T, echo=F, warning=FALSE, message=FALSE}
# polygon map
library(shiny)
library(htmlwidgets)
library(dplyr)
library(leaflet)
library(maps)
# need to embed in an app to use in slide show
shinyApp(
ui = fluidPage(leafletOutput('MAP')),
server = function(input, output) {
map <- leaflet() %>%
addTiles(group = "OSM") %>% # Add default OpenStreetMap map tiles
addProviderTiles("Esri.WorldImagery", group = "ESRI Aerial") %>%
addMarkers(lng=-121.8008111, lat=38.6295194, popup="Panel 1") %>%
# add controls for basemaps and data
addLayersControl(
baseGroups = c("ESRI Aerial", "OSM"),
options = layersControlOptions(collapsed = FALSE))
# generate final map and output
output$MAP = renderLeaflet(map)
},
options=list(height="500px")
)
R
```
Brandon Hurr
Nov 30, 2015, 11:27:50 PM11/30/15
to davi...@googlegroups.com, Ryan Peek
Ryan,
Thanks for this. Were you able to get it to go into the second column?
No amount of extra space seems to help... oh well. I may have to use a fixed image anyway, where I'll be giving the presentation the internet is notoriously poor so.
I've installed LeafletR and look forward to a non-shiny example.
Thanks,
Brandon
--
Check out our R resources at http://www.noamross.net/davis-r-users-group.html
---
You received this message because you are subscribed to the Google Groups "Davis R Users' Group" group.
To unsubscribe from this group and stop receiving emails from it, send an email to davis-rug+...@googlegroups.com.
Visit this group at http://groups.google.com/group/davis-rug.
For more options, visit https://groups.google.com/d/optout.
Ryan Peek
Dec 1, 2015, 2:46:13 AM12/1/15
to Davis R Users' Group, rap...@ucdavis.edu
Weird...just realized that was happening, it ran just fine in the inital RStudio window but I had the same issue in two different browsers. However, for some reason it does work just fine if you put the shiny/map chunk first, and the bullets second. I have no idea why.
As for using leafletr, you need to create an html map first (example below). Then as long as that html file is in the same location as your Rmd file, and you aren't using any other shiny based chunks, you can simply reference that html in your Rmd, and write your entire Rmd file (or slides) to a html file. It embeds the html map into your slides (and seems to work fine with 2 column slide layouts). Bear in mind you do need internet to surf around a bit, but it's still stand-alone which is nice. leafletr is a little more involved than the basic leaflet package because it needs a spatial dataframe (points or polygons) to work, and it's best if reading from a geojson type file (you can always convert shapefiles, gpx, kmz, etc. to geojson). I tried to set up an example below so you can see this all in action. Let me know if you have questions, hopefully this works on your machine. The Rmd file I used for all this is attached.
## leafletR example:
library(sp)
library(leafletR)
library(rgdal)
# make some data
df<-data.frame(long=seq(-121.8008,-121.8908,-0.0100),
lat=seq(38.6295, 38.7195,0.0100), label=sprintf("Panel %d",1:10))
# designate your lat/longs
xy <- df[,c(1,2)]
# use rgdal to create spatial data frame (and add projection WGS84)
spdf <- SpatialPointsDataFrame(coords = xy,
data = df,
proj4string = CRS("+proj=longlat +datum=WGS84 +ellps=WGS84"))
# convert to GeoJSON (efficient storage of spatial data...can save data with webpage)
dfjson<-toGeoJSON(data=spdf, name="tst")
# now try making a leafletR map
map<-leaflet(data=dfjson, style=styleSingle(col="blue", fill.alpha=0.8),
base.map=list("osm","tls"))
# view map
browseURL(map)
Adios,
R
R
To unsubscribe from this group and stop receiving emails from it, send an email to davis-rug+unsubscribe@googlegroups.com.
Reply all
Reply to author
Forward
0 new messages