Re: R question follow-up
7 views
Skip to first unread message

Jaime Ashander
Sep 1, 2015, 5:49:58 PM9/1/15
to John Williams, davi...@googlegroups.com
Hi John,
Sorry your follow up slipped through the cracks. Cc'ing the list on replies like your question below might help avoid this in the future (though only if someone else picks up the slack. In this case, that would involve parsing my messy code, so not too likely. In any case I cc the list here for everyone's benefit:
The lines:
d.mat[ 1:plots.per.site, 1:plots.per.site] <- within.site.value
d.mat[ (plots.per.site + 1):(2*plots.per.site), (plots.per.site + 1):(2 * plots.per.site)] <- within.site.value
d.mat[ (plots.per.site + 1):(2*plots.per.site), (plots.per.site + 1):(2 * plots.per.site)] <- within.site.value
are setting the two off-diagonal blocks of size `plots.per.site` to `within.site.value`, earlier set as NA. Since you have blocks of A=41 and B=43 plots, you could do this
plots.A <- 41
plots.B <- 43
total.plots <- plots.A + plots.B
d.mat[ 1:plots.B, 1:plots.A] <- within.site.value
d.mat[ (plots.A + 1) : total.plots, (plots.A + 1) : total.plots] <- within.site.value
d.mat[ (plots.A + 1) : total.plots, (plots.A + 1) : total.plots] <- within.site.value
best,
Jaime
On Tue, Sep 1, 2015 at 2:38 PM, John Williams <jnwil...@gmail.com> wrote:
JohnThanks!Hi Jaime,Sorry to bother you again about this, but any thoughts on the question below?On Sun, Aug 23, 2015 at 9:58 AM, John Williams <jnwil...@gmail.com> wrote:Jaime,
Jaime Ashander <jash...@ucdavis.edu>: Aug 19 05:47PM -0700
Jaime,
Thanks for your help with this, and sorry it's taken me until now to get back to you. Your suggestion looks like it will work. I have a question about how I deal with the fact that my sites have different number of plots (sorry, my sample data didn't include that detail). So, if I understand the code you wrote, where
plots.per.site <- 5
but I actually have plots at site A = 41 and plots at site B = 43.Also, and this probably goes hand-in-hand with the answer to the question above, can you just briefly explain how the 2 lines of code below that you wrote work?Thanks so much!John
d.mat[ 1:plots.per.site, 1:plots.per.site] <- within.site.value
d.mat[ (plots.per.site + 1):(2*plots.per.site), (plots.per.site + 1):(2 * plots.per.site)] <- within.site.value
John,
This might get you there. I think it's in the spirit of what Steve
suggested: do all the comparisons, make the within-site comparisons null,
then take the average ignoring the null values.
library(vegan)
read.csv("JW_Sample_Sorensen.csv") -> d
1 - vegdist(d[ ,-1], method="bray", binary=T, diag=T) -> d.dist
# within.site out within sites
plots.per.site <- 5
within.site.value <- NA
d.mat <- as.matrix(d.dist)
d.mat[ 1:plots.per.site, 1:plots.per.site] <- within.site.value
d.mat[ (plots.per.site + 1):(2*plots.per.site), (plots.per.site + 1):(2 *
plots.per.site)] <- within.site.value
#if you have > 2 sites need to put the above in a loop
# basic strategy is to make all NA within the block diagonal matrix of sites
d.site.dist <- as.dist(d.mat)
# this gives the mean across all comparisons between of plots between the
two
# sites. for > 2 sites geting site-site distances would be more complicated
mean(d.site.dist, na.rm=TRUE)
[1] 0.2855238
Jaime Ashander
Sep 1, 2015, 5:55:01 PM9/1/15
to davi...@googlegroups.com
Oops, I wrote "off-diagonal" but meant "diagonal".
--
Check out our R resources at http://www.noamross.net/davis-r-users-group.html
---
You received this message because you are subscribed to the Google Groups "Davis R Users' Group" group.
To unsubscribe from this group and stop receiving emails from it, send an email to davis-rug+...@googlegroups.com.
Visit this group at http://groups.google.com/group/davis-rug.
For more options, visit https://groups.google.com/d/optout.

John Williams
Sep 1, 2015, 6:25:00 PM9/1/15
to Jaime Ashander, davi...@googlegroups.com
Hey Jaime,
Thanks for the quick reply. So, if I understand you right, the code I have now is listed below. It runs through ok without any hiccups, but I'm not convinced that it's doing the right thing, because the value it gives seems much too big. I am attaching the csv file here, in case you have a chance to take a look at it. My species are in the columns and plots are in rows (column A has plot names). What I want to do is compare the J plots to O plots. Looking at the CSV file and the code you sent, do you think that's what's happening and 0.19 is the average J x O plot similarity value?library(vegan)
read.csv ("C:/Users/Owner/Documents/Spp_abund_x_plot_all.csv", header=T, row.names=1) -> d
1 - vegdist(d[ ,-1], method="bray", binary=T, diag=T) -> d.dist
# within.site out within sites
plots.A <- 41
plots.B <- 43
total.plots <- plots.A + plots.B
plots.B <- 43
total.plots <- plots.A + plots.B
within.site.value <- NA
d.mat[ 1:plots.B, 1:plots.A] <- within.site.value
d.mat[ (plots.A + 1) : total.plots, (plots.A + 1) : total.plots] <- within.site.value
d.mat <- as.matrix(d.dist)
# basic strategy is to make all NA within the block diagonal matrix of sites
d.site.dist <- as.dist(d.mat)
# this gives the mean across all comparisons between of plots between the two
# sites. for > 2 sites geting site-site distances would be more complicated
mean(d.site.dist, na.rm=TRUE)
[1] 0.193819
Jaime Ashander
Sep 1, 2015, 8:08:13 PM9/1/15
to davi...@googlegroups.com
d.mat needs to exist before you zero-out the off-diagonal blocks. move the line
d.mat <- as.matrix(d.dist)
to after d.dist is created. Actually there's also a typo in my earlier email, so use:
plots.A <- 41
plots.B <- 43
total.plots <- plots.A + plots.B
within.site.value <- NA
d.mat <- as.matrix(d.dist)
d.mat[ 1:plots.A, 1:plots.A] <- within.site.value
d.mat[ (plots.A + 1) : total.plots, (plots.A + 1) : total.plots] <- within.site.value
image(d.mat)
that last line prints an image so you can see the diagonals are zeroed-out. well, they look like the off-diagonals in the image for obscure (I assume, b/c it's R) reasons
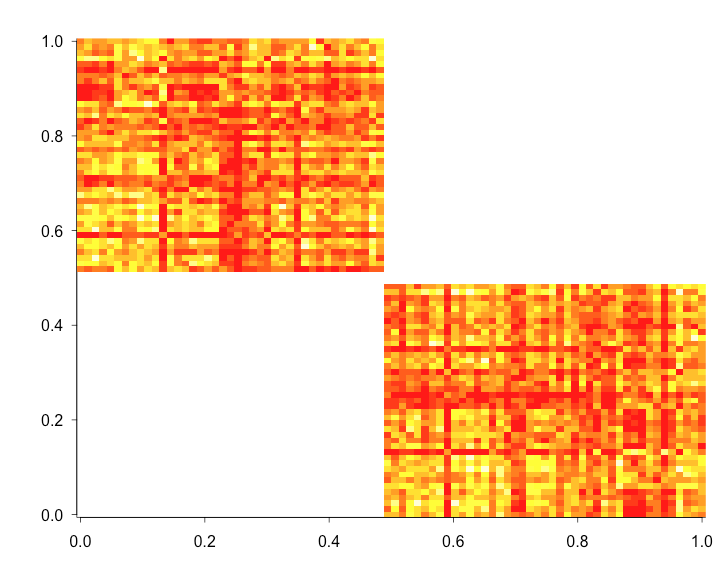
after zero-ing out to see if it worked. With that, I get:
[1] 0.1403341
Reply all
Reply to author
Forward
0 new messages