Data visualization of municipal annual budget
98 views
Skip to first unread message

Nikhil VJ
Aug 10, 2015, 3:11:24 AM8/10/15
to datameet
Hi Friends,
Would you be interested in collaborating to visualize a city's budget data?http://nikhilsheth.techydudes.net/files/sunburst%20hover%20details%20csv.html
This was made possible by introducing a "parent" code column in the data. A CSV with this basic structure:
Code, Parent Code, Amount, [more details]
..then yields a variable-depth data visualization.
For your reference, here's the data powering the above viz: http://nikhilsheth.techydudes.net/files/electrical5.csv
This year, I have the whole annual budget of Pune in spreadsheet form (http://tiny.cc/punebudget2015), ready for a little cleanup and curating, after which we could make a data visualization of each of its sections.
The tasks involved can go beyond my individual bandwidth and jugaadu programming abilities, but with a few more people on board we could pull off something cool. So looking for collaborators : both in visualization programming (lets explore more ways of visualizing!), as well as for the simple and repetitive but necessary tasks of cleaning up, curating the data, for which you only need basic excel skills and that most precious resource: time!
Where this could go, in the larger context : Possibility of a buy-in from the Pune Municipal Corporation to incorporate this as a e-budget, e-governance, smart city feature. But please don't lynch me if this doesn't happen.. no certainty here. At least we (CEE) have met the municipal commissioner (for another topic: budget restructuring) and have talked about this on the side. A good proof-of-concept would really help to make a strong case for this.
--
Cheers,
Nikhil
+91-966-583-1250
Pune, India
Self-designed learner at Swaraj University <http://www.swarajuniversity.org>
http://nikhilsheth.blogspot.in
Cheers,
Nikhil
+91-966-583-1250
Pune, India
Self-designed learner at Swaraj University <http://www.swarajuniversity.org>
http://nikhilsheth.blogspot.in

Meera
Aug 12, 2015, 1:28:42 PM8/12/15
to data...@googlegroups.com
Looks interesting.. The Oorvani team will be happy to work, for Bangalore budget. Janaagraha has already done some work cleaning up the data.
Shree will ping you offline to discuss this more...
Best Regds, Meera
--
Datameet is a community of Data Science enthusiasts in India. Know more about us by visiting http://datameet.org
---
You received this message because you are subscribed to the Google Groups "datameet" group.
To unsubscribe from this group and stop receiving emails from it, send an email to datameet+u...@googlegroups.com.
For more options, visit https://groups.google.com/d/optout.
Nikhil VJ
Aug 14, 2015, 3:00:23 AM8/14/15
to data...@googlegroups.com
Hi Friends,
Great responses from many places (got many private replies from people
wanting to do this at their end too). Thanks for your interest!
One correction I'll make to my last email: Curating will happen, no
probs. It's the programming to do the visualization properly that's in
short supply right now and awaiting some of your magic touch :)
I'll share below some links that should open this up better for anyone
interested.
The Pune budget book's individual sections, separated and in CSV format:
http://nikhilvj.techydudes.net/files/data/csv201516/
Github Gist of the visualization I had made last year.. just download
zip from the right and you'll have all the involved files in one place
and can play around with them:
https://gist.github.com/answerquest/3c6bae2f00ff17ead99e
I did not find that form effective enough for the task at hand; found
another which seems perfect for our needs : Zoomable Treemap, with
boxes in boxes and ample room to write the numbers and longish titles
and references that are in my dataset. So I'm primarily looking for
how to achieve the programming and the right kind of input data format
for this:
http://bost.ocks.org/mike/treemap/
This link explained some things, but their method needed the data in a
form that I wasn't able to produce, and I had hit a dead end there.
https://secure.polisci.ohio-state.edu/faq/d3/zoomabletreemap_code.php
Other links for inspiration:
Real world budget visualization examples:
http://data.jmsc.hku.hk/hongkong/budget/2013/
Simple top-level overview
http://www.nytimes.com/interactive/2012/02/13/us/politics/2013-budget-proposal-graphic.html?_r=0
http://www.nytimes.com/packages/html/newsgraphics/2011/0119-budget/
Obama’s 2012 Budget Proposal
http://www.arlingtonvisualbudget.org/expenses
http://datadrivenjournalism.net/featured_projects/Behind_the_Australian_Financial_Reviews_Budget_Explorer
>>in-depth explanation of how this project created the budget visualization, incl real-world experts' inputs, historical context, etc
Visualization code examples (using dummy data)
http://bost.ocks.org/mike/treemap/
Rectangular treemap
http://bl.ocks.org/kerryrodden/7090426
sequences sunburst / radial with mousover highlighting
(For Pune's data, this could work by splitting the budget code column
like so: RE11A108 -> RE,11,A,108. Thought it would be an automated
split-up and not along real divisions which have a lot of unions and
overlaps of different codes, plus a lot of the info grouping multiple
items is there in lines that don't have any budget code entered and
can get lost)
http://mbostock.github.io/d3/talk/20111018/partition.html
Left-to-right hierarchical bars
http://bl.ocks.org/mbostock/1005873
top-to-down hierarchical bars
http://bl.ocks.org/mbostock/5944371
Bilevel Partition : 2-level pie chart that you can keep digging into..
I had not been able to make it work with my electrical data last year
and couldn't explain why it wasn't working when the full sunburst was.
--
Cheers,
Nikhil
+91-966-583-1250
Pune, India
Self-designed learner at Swaraj University <http://www.swarajuniversity.org>
http://nikhilsheth.blogspot.in
>> <http://tiny.cc/punebudget2015>)*, ready for a little cleanup and
--
Great responses from many places (got many private replies from people
wanting to do this at their end too). Thanks for your interest!
One correction I'll make to my last email: Curating will happen, no
probs. It's the programming to do the visualization properly that's in
short supply right now and awaiting some of your magic touch :)
I'll share below some links that should open this up better for anyone
interested.
The Pune budget book's individual sections, separated and in CSV format:
http://nikhilvj.techydudes.net/files/data/csv201516/
Github Gist of the visualization I had made last year.. just download
zip from the right and you'll have all the involved files in one place
and can play around with them:
https://gist.github.com/answerquest/3c6bae2f00ff17ead99e
I did not find that form effective enough for the task at hand; found
another which seems perfect for our needs : Zoomable Treemap, with
boxes in boxes and ample room to write the numbers and longish titles
and references that are in my dataset. So I'm primarily looking for
how to achieve the programming and the right kind of input data format
for this:
http://bost.ocks.org/mike/treemap/
This link explained some things, but their method needed the data in a
form that I wasn't able to produce, and I had hit a dead end there.
https://secure.polisci.ohio-state.edu/faq/d3/zoomabletreemap_code.php
Other links for inspiration:
Real world budget visualization examples:
http://data.jmsc.hku.hk/hongkong/budget/2013/
Simple top-level overview
http://www.nytimes.com/interactive/2012/02/13/us/politics/2013-budget-proposal-graphic.html?_r=0
http://www.nytimes.com/packages/html/newsgraphics/2011/0119-budget/
Obama’s 2012 Budget Proposal
http://www.arlingtonvisualbudget.org/expenses
http://datadrivenjournalism.net/featured_projects/Behind_the_Australian_Financial_Reviews_Budget_Explorer
>>in-depth explanation of how this project created the budget visualization, incl real-world experts' inputs, historical context, etc
Visualization code examples (using dummy data)
http://bost.ocks.org/mike/treemap/
Rectangular treemap
http://bl.ocks.org/kerryrodden/7090426
sequences sunburst / radial with mousover highlighting
(For Pune's data, this could work by splitting the budget code column
like so: RE11A108 -> RE,11,A,108. Thought it would be an automated
split-up and not along real divisions which have a lot of unions and
overlaps of different codes, plus a lot of the info grouping multiple
items is there in lines that don't have any budget code entered and
can get lost)
http://mbostock.github.io/d3/talk/20111018/partition.html
Left-to-right hierarchical bars
http://bl.ocks.org/mbostock/1005873
top-to-down hierarchical bars
http://bl.ocks.org/mbostock/5944371
Bilevel Partition : 2-level pie chart that you can keep digging into..
I had not been able to make it work with my electrical data last year
and couldn't explain why it wasn't working when the full sunburst was.
--
Cheers,
Nikhil
+91-966-583-1250
Pune, India
Self-designed learner at Swaraj University <http://www.swarajuniversity.org>
http://nikhilsheth.blogspot.in
On 8/12/15, Meera <meer...@gmail.com> wrote:
> Looks interesting.. The Oorvani team will be happy to work, for Bangalore
> budget. Janaagraha has already done some work cleaning up the data.
> Shree will ping you offline to discuss this more...
>
> Best Regds, Meera
>
> On Mon, Aug 10, 2015 at 12:41 PM, Nikhil VJ <nikh...@gmail.com> wrote:
>
>> Hi Friends,
>>
>> Would you be interested in collaborating to visualize a city's budget
>> data?
>>
>> Here's something I drummed up last year when analyzing electrical related
>> expenditures, in a very quick-and-dirty d3.js mashup:
>>
>> http://nikhilsheth.techydudes.net/files/sunburst%20hover%20details%20csv.html
>>
>>
>> This was made possible by introducing a "parent" code column in the data.
>> A CSV with this basic structure:
>> Code, Parent Code, Amount, [more details]
>> ..then yields a variable-depth data visualization.
>>
>> For your reference, here's the data powering the above viz:
>> http://nikhilsheth.techydudes.net/files/electrical5.csv
>>
>> This year, I have the whole annual budget of Pune in spreadsheet form
>> (*http://tiny.cc/punebudget2015
> Looks interesting.. The Oorvani team will be happy to work, for Bangalore
> budget. Janaagraha has already done some work cleaning up the data.
> Shree will ping you offline to discuss this more...
>
> Best Regds, Meera
>
> On Mon, Aug 10, 2015 at 12:41 PM, Nikhil VJ <nikh...@gmail.com> wrote:
>
>> Hi Friends,
>>
>> Would you be interested in collaborating to visualize a city's budget
>> data?
>>
>> Here's something I drummed up last year when analyzing electrical related
>> expenditures, in a very quick-and-dirty d3.js mashup:
>>
>> http://nikhilsheth.techydudes.net/files/sunburst%20hover%20details%20csv.html
>>
>>
>> This was made possible by introducing a "parent" code column in the data.
>> A CSV with this basic structure:
>> Code, Parent Code, Amount, [more details]
>> ..then yields a variable-depth data visualization.
>>
>> For your reference, here's the data powering the above viz:
>> http://nikhilsheth.techydudes.net/files/electrical5.csv
>>
>> This year, I have the whole annual budget of Pune in spreadsheet form
>> <http://tiny.cc/punebudget2015>)*, ready for a little cleanup and
Nikhil VJ
Feb 14, 2016, 8:49:06 PM2/14/16
to datameet
Hi Friends,
Writing back on this thread after long. Last couple of weeks have been quite exciting. We (CEE) are working with the Pune Municipal Corporation on budget reform, prioritization and.. other things that I haven't really wrapped my head around as yet.But long story short, for the first time, Pune has released an excel version of its draft annual budget for 2016-17. We hope the practice carries on.. some words of encouragement sent to the municipal commissioner''s office or accounts dept would go a long way. You can check it out here: PMC's budget page, and a joint site by PMC and my peeps, OurPuneOurBudget.in (extra: check out the WISE maps there)
On Saturday, we (Datameet Pune Chapter) met up with a few interested members to discuss about what all we can do with this. We hammered out some tasks, identified some sectors to focus on and are going to try and get some analysis out or better, some more organized data out. So, work is ongoing.. if you're interested then join in.. write to us on pu...@datameet.org
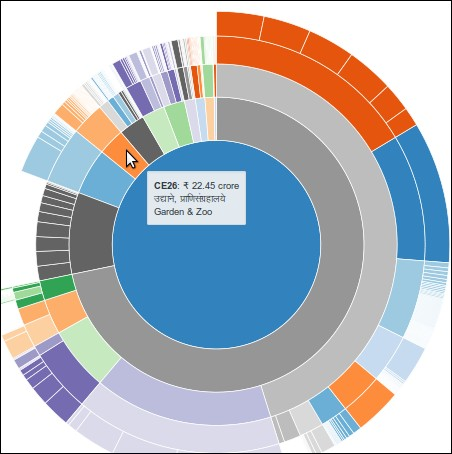
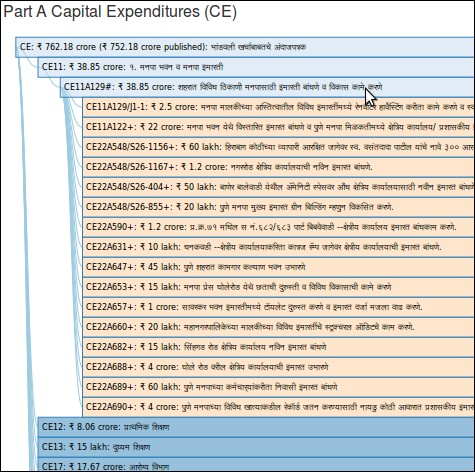
Regarding my previous emails on formatting & structuring of the data so as to make it amenable to visualization etc, I was able to figure some things out, and... I think it's better to explain through pictures:
A tool you can use to convert your data from this...

...into this

>> so you can do things like this with it

So here it is:
http://sahbhag.in/files/selfrefCSV_2_hierarchJSON.html
The github gist link for the script is there on that webpage in case you want to explore the code. Please check out the tool and let me know if it's useful for you, if its too confusing, what needs improvement etc. For me, what's important is that this gives me the missing link between real world data which we keep in tabular format, and the awesome d3.js visualizations.
An output of it (note: work in progress! totals are incorrect) : http://sahbhag.in/files/pune-budget-viz-1.html
A tool you can use to convert your data from this...
...into this
>> so you can do things like this with it
So here it is:
http://sahbhag.in/files/selfrefCSV_2_hierarchJSON.html
So here it is:
http://sahbhag.in/files/selfrefCSV_2_hierarchJSON.html
The github gist link for the script is there on that webpage in case you want to explore the code. Please check out the tool and let me know if it's useful for you, if its too confusing, what needs improvement etc. For me, what's important is that this gives me the missing link between real world data which we keep in tabular format, and the awesome d3.js visualizations.
An output of it (note: work in progress! totals are incorrect) : http://sahbhag.in/files/pune-budget-viz-1.html
Nikhil VJ
Feb 19, 2016, 10:04:37 AM2/19/16
to datameet
Hi,
Sorry if I'm spamming now..http://sahbhag.in/ourpuneourbudget/files/pune-budget-viz-2.html
http://sahbhag.in/ourpuneourbudget/files/pune-budget-viz-3.html

Pratap Vardhan
Feb 19, 2016, 10:22:11 AM2/19/16
to datameet
I prefer rectangles over circles, for the ease of reading. You may want to consider Treemaps? Something like https://www.whitehouse.gov/interactive-budget ? Thanks for sharing.
Nikhil VJ
Feb 19, 2016, 1:25:52 PM2/19/16
to data...@googlegroups.com
Yes yes whatever works! Please make one work with your data and share
the code! :D
On 2/19/16, Pratap Vardhan <prat...@gmail.com> wrote:
> I prefer rectangles over circles, for the ease of reading. You may want to
> consider Treemaps? Something
> like https://www.whitehouse.gov/interactive-budget ? Thanks for sharing.
>
> On Monday, August 10, 2015 at 12:41:24 PM UTC+5:30, Nikhil VJ wrote:
>>
>> Hi Friends,
>>
>> Would you be interested in collaborating to visualize a city's budget
>> data?
>>
>> Here's something I drummed up last year when analyzing electrical related
>>
>> expenditures, in a very quick-and-dirty d3.js mashup:
>>
>> http://nikhilsheth.techydudes.net/files/sunburst%20hover%20details%20csv.html
>>
>>
>> This was made possible by introducing a "parent" code column in the data.
>>
>> A CSV with this basic structure:
>> Code, Parent Code, Amount, [more details]
>> ..then yields a variable-depth data visualization.
>>
>> For your reference, here's the data powering the above viz:
>> http://nikhilsheth.techydudes.net/files/electrical5.csv
>>
>> This year, I have the whole annual budget of Pune in spreadsheet form
>> (*http://tiny.cc/punebudget2015
>> <http://tiny.cc/punebudget2015>)*, ready for a little cleanup and
the code! :D
On 2/19/16, Pratap Vardhan <prat...@gmail.com> wrote:
> I prefer rectangles over circles, for the ease of reading. You may want to
> consider Treemaps? Something
> like https://www.whitehouse.gov/interactive-budget ? Thanks for sharing.
>
> On Monday, August 10, 2015 at 12:41:24 PM UTC+5:30, Nikhil VJ wrote:
>>
>> Hi Friends,
>>
>> Would you be interested in collaborating to visualize a city's budget
>> data?
>>
>> Here's something I drummed up last year when analyzing electrical related
>>
>> expenditures, in a very quick-and-dirty d3.js mashup:
>>
>> http://nikhilsheth.techydudes.net/files/sunburst%20hover%20details%20csv.html
>>
>>
>> This was made possible by introducing a "parent" code column in the data.
>>
>> A CSV with this basic structure:
>> Code, Parent Code, Amount, [more details]
>> ..then yields a variable-depth data visualization.
>>
>> For your reference, here's the data powering the above viz:
>> http://nikhilsheth.techydudes.net/files/electrical5.csv
>>
>> This year, I have the whole annual budget of Pune in spreadsheet form
>> <http://tiny.cc/punebudget2015>)*, ready for a little cleanup and
> --
> Datameet is a community of Data Science enthusiasts in India. Know more
> about us by visiting http://datameet.org
> ---
> You received this message because you are subscribed to the Google Groups
> "datameet" group.
> To unsubscribe from this group and stop receiving emails from it, send an
> email to datameet+u...@googlegroups.com.
> For more options, visit https://groups.google.com/d/optout.
>
--
Reply all
Reply to author
Forward
0 new messages