query on data re-organizing : 2-dimensional to single flow
28 views
Skip to first unread message

Nikhil VJ
Mar 29, 2017, 8:54:49 AM3/29/17
to datameet
Hi friends,
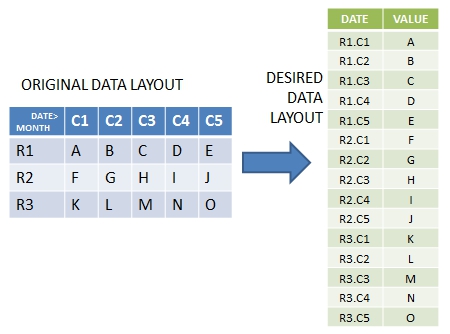
Data re-organizing query : How can we reformat this data (see attached
excel) so that a visualizer can read it and render it as a graph with
dates in x-axis? The data is arranged two-dimensionally (rows by month
and different column for each day) and we need to convert the data to
a one-dimensional table (sample shown in second worksheet in the
attachment). There are quite a lot of such tables out there so it
would be great to know of a programmatic way of achieving this.
---------- Forwarded message ----------
From: Abhijeet Kamble <abhijee...@ceeindia.org>
Date: Wed, 29 Mar 2017 16:00:45 +0530
Subject: Fwd: GIS GeoOdk Data
To: Nikhil VJ <nikh...@gmail.com>
I forget to send you the same....
May be useful for someone in your network...
--
Abhijeet Kamble
Project Officer (MGB)
Centre for Environment Education
Central Regional Cell
Pinewood Apartment
S No 233/1/2, Vidhate Colony, Baner, Pune 411 067
Landmark : Ahead of Medipoint Hospital
URL: www.ceeindia.org
Phone: 020 - 27298861 / 9922151915
Google maplink http://goo.gl/maps/rthpc
~*Water has very sharp memory, it never forget it's path...*~
--
--
Cheers,
Nikhil
+91-966-583-1250
Pune, India
Self-designed learner at Swaraj University <http://www.swarajuniversity.org>
Blog <http://nikhilsheth.blogspot.in> | Contribute
<https://www.payumoney.com/webfronts/#/index/NikhilVJ>

Pratap Vardhan
Mar 29, 2017, 11:57:37 AM3/29/17
to datameet
Better suited for Stackoverflow. Here's a way to doing it in python.
import pandas as pd

df = pd.read_excel('Downloads/RF_Pashan.xls', 'Sheet4')
# Subselect your data, since data irregularly formatted
dff = df.ix[2:, 2:-5]
# Rename column names
dff.columns = ['Year', 'Month'] + range(1, 32)
dff2 = dff.set_index(['Year', 'Month']).stack()
# Final required format
rain = pd.DataFrame({
    'date': dff2.index.to_series().apply(lambda x: '{2:02.0f}-{1}-{0}'.format(*x)).values,
    'rainfall': dff2.values})
# Export to csv file
rain.to_csv('rain.csv', index=False)


         date rainfall
0  01-01-1999        0
1  02-01-1999        0
2  03-01-1999        0
3  04-01-1999        0
4  05-01-1999        0
Regards,
Pratap Vardhan
Nikhil VJ
Mar 29, 2017, 1:10:25 PM3/29/17
to data...@googlegroups.com
Hi Pratap,
They don't tolerate non-coders in stackoverflow :P
Thanks for sharing the script! Now can someone put it up online somewhere ;)
This one is presently beyond my scope of programming skills, but IMHO
falls within Datameet's mandate because a very large amount of the
data we want to work with does in fact get stored in different ways
that are friendly for human data entry but not directly
machine-readable. Most notably in a two-dimensional layout similar to
the weekly timetable most of us had in school.
One more lead :
https://shancarter.github.io/mr-data-converter/
I think the "XML-Nodes" output mode IS doing the job; one only has to
alter the output string formatting.
> --
> Datameet is a community of Data Science enthusiasts in India. Know more
> about us by visiting http://datameet.org
> ---
> You received this message because you are subscribed to the Google Groups
> "datameet" group.
> To unsubscribe from this group and stop receiving emails from it, send an
> email to datameet+u...@googlegroups.com.
> For more options, visit https://groups.google.com/d/optout.
They don't tolerate non-coders in stackoverflow :P
Thanks for sharing the script! Now can someone put it up online somewhere ;)
This one is presently beyond my scope of programming skills, but IMHO
falls within Datameet's mandate because a very large amount of the
data we want to work with does in fact get stored in different ways
that are friendly for human data entry but not directly
machine-readable. Most notably in a two-dimensional layout similar to
the weekly timetable most of us had in school.
One more lead :
https://shancarter.github.io/mr-data-converter/
I think the "XML-Nodes" output mode IS doing the job; one only has to
alter the output string formatting.
> Datameet is a community of Data Science enthusiasts in India. Know more
> about us by visiting http://datameet.org
> ---
> You received this message because you are subscribed to the Google Groups
> "datameet" group.
> To unsubscribe from this group and stop receiving emails from it, send an
> email to datameet+u...@googlegroups.com.
> For more options, visit https://groups.google.com/d/optout.

Dilip Damle
Apr 1, 2017, 2:58:03 AM4/1/17
to datameet
HI,
I have answered a almost exactly similar question on Quora using VBA
Please see my answer here
I have answered a almost exactly similar question on Quora using VBA
Please see my answer here
There are other answers to that question.
I would use my own VBA for this task.
But after the quora question and other answers I learnt that the latest version of excel have UNPIVOT feature which can do the above task.
Please google UNPIVOT
Regards
Dilip Damle
You can find me hanging around at this place most often
https://www.quora.com/profile/Dilip-Damle
Nikhil VJ
Apr 10, 2017, 10:54:33 AM4/10/17
to data...@googlegroups.com
Hi All,
Thank you for your valuable inputs.
I found a tool called "mr. data converter" that gave one kind of
output (json-dictionary) in a good format that could then be taken
further.
One issue there was that in case of blank cell (like in my dataset,
feb doesn't have data for 29,30,31 dates), the program was assigning 0
and it should be NULL or so instead. I couldn't understand the code
enough to change it from the inside, but figured out a hack at the
output end. Then, I made a separate page to convert the json obtained
to desired output.
I forked the project and added code of my own. Here's the tool I'm
calling "Table un-pivot" based on Dilip's inputs.
https://answerquest.github.io/table-unpivot/
Please use it when you have 2-dimensional (or pivoted) data and need
to make it single-flow (or un-pivoted).
> --
> Datameet is a community of Data Science enthusiasts in India. Know more
> about us by visiting http://datameet.org
> ---
> You received this message because you are subscribed to the Google Groups
> "datameet" group.
> To unsubscribe from this group and stop receiving emails from it, send an
> email to datameet+u...@googlegroups.com.
> For more options, visit https://groups.google.com/d/optout.
>
Reply all
Reply to author
Forward
0 new messages