Project to make managing bus routes much easier for any bus authority : looking for a few creative coders
27 views
Skip to first unread message

Nikhil VJ
May 13, 2016, 12:33:16 AM5/13/16
to
Hi Friends,
Please connect with anyone who would like to do some fundoo coding-for-public:
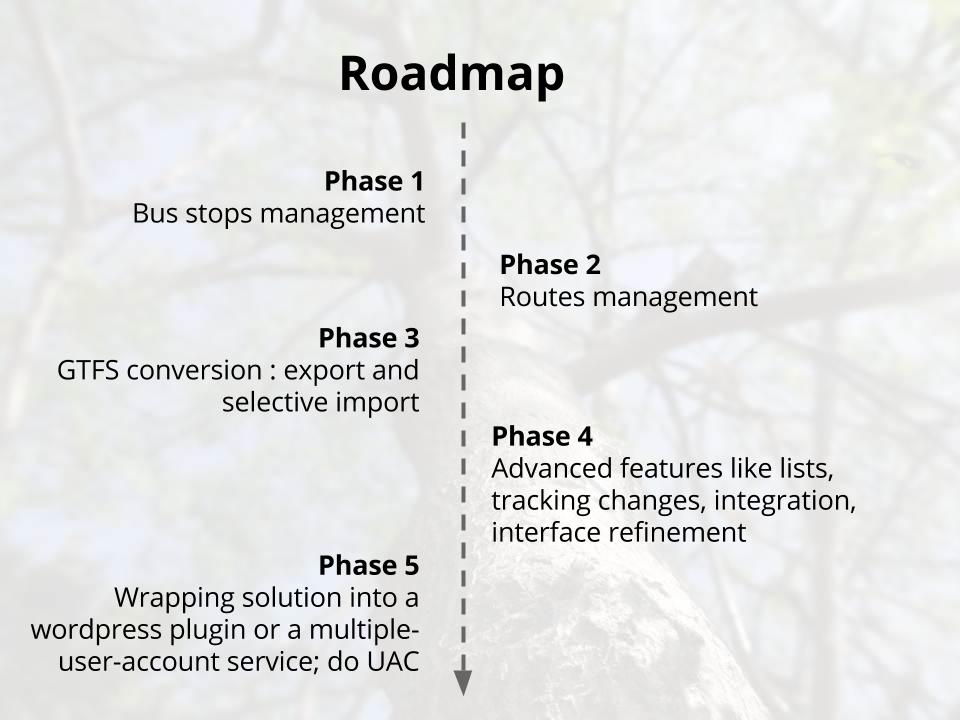
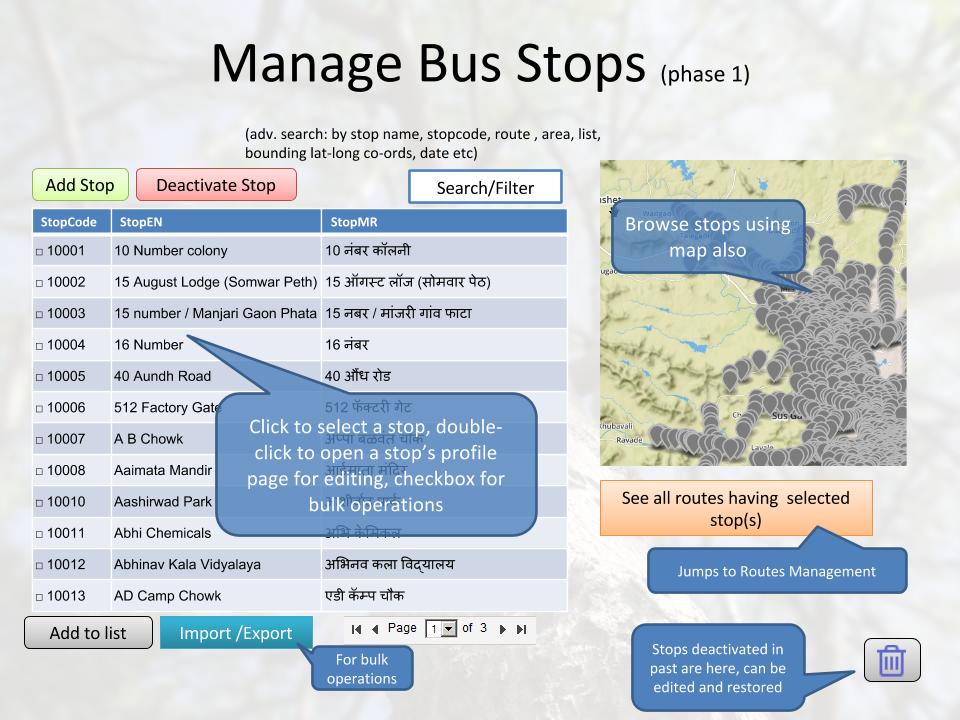
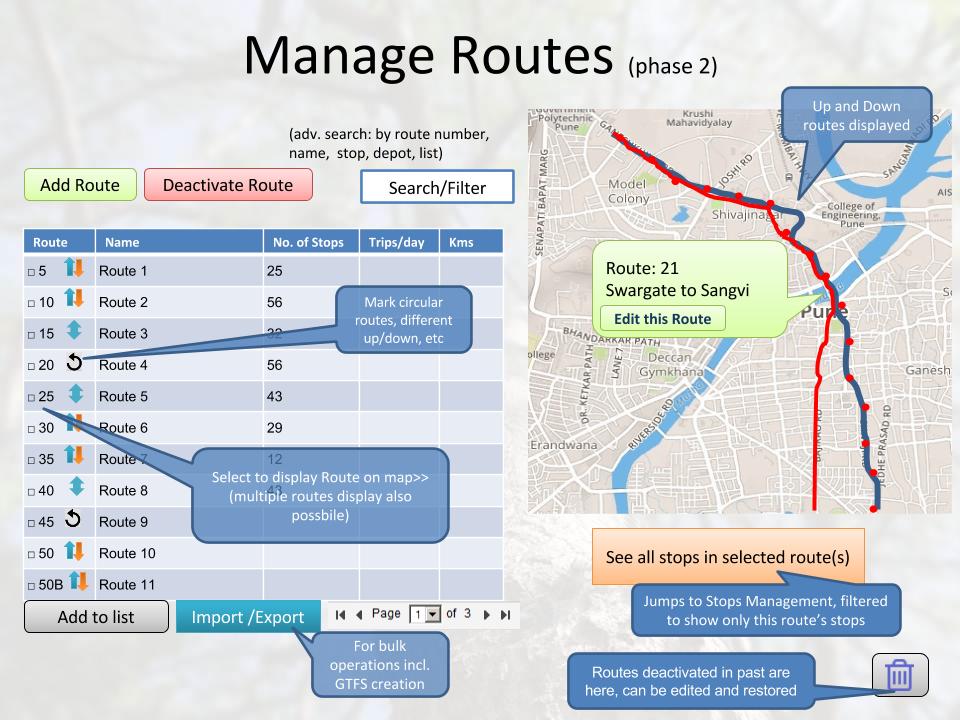
Design document: (a ppt slideshow) : Bus Route Information Management System
(lots of things ironed out since the last time I spammed you about this, and I've now broken it down to phases where initial ones would be fairly simple to implement)
Specific detail: As far as possible I want to pull this off on PHP/SQL/Javascript platform.
If you could connect me with a pune-based college's computer science department it would be heavenly!
Sharing a few of the slides to stoke your imagination..

(please see the link shared at top for seeing all the slides)


Disclaimer note: If you believe you're a .NET-only developer then this is not for you. And, absolutely no hi-fi advanced server/stack based solutions allowed which require complicated command-line installations on server side and need to be maintained as if they're some freakin' nuclear power plant. This whole thing can run off just 2 tables in its most basic form (phase 1&2), so let's keep things simple. Aur copyright / IPR ki baat ki toh chappal khayegaa.
Read some FAQs here.
Thanks for your time! Do connect if interested!
--
Cheers,
Nikhil
+91-966-583-1250
Pune, India
Self-designed learner at Swaraj University <http://www.swarajuniversity.org>
http://nikhilsheth.blogspot.in
Cheers,
Nikhil
+91-966-583-1250
Pune, India
Self-designed learner at Swaraj University <http://www.swarajuniversity.org>
http://nikhilsheth.blogspot.in

shantanu oak
May 14, 2016, 6:54:08 AM5/14/16
to datameet
Hi Nikhil,
Here is 5 lines of python code that will help to visualize the routes on google maps like this..
As per your disclaimer this is not .NET code nor hi-fi server required. Anyone can visualize lat-lon data Using the 2 tables mentioned in phase 1 and 2.
# Downloaded routes and stops from the sheets
# imported the csv data into python pandas dataFrame
import pandas as pd
routes = pd.read_csv('routes.csv',usecols=["Route Num", "StopNo", "StopEN", "StopCode"])
stops = pd.read_csv('stops.csv',usecols=["stop_id", "stop_name", "stop_desc","stop_lat", "stop_lon"])
# Merge these 2 frames on stop code - id this is one to many relation
# one stop_id from stops table can be in many routes
df=pd.merge(routes, stops, left_on='StopCode', right_on='stop_id')
# Find co-ordinates of all stops of a given route for e.g. 1000XD and export the data to csv file
df.loc[df['Route Num'] == '1000XD'][['stop_lat', 'stop_lon']].to_csv('myroute.csv', index=False)
# open the csv and pass the values to google map
!cat myroute.csv
This can also be achieved using php+mysql but using python-pandas makes it extensible and easy to integrate.
-- Shantanu Oak
Nikhil VJ
May 16, 2016, 3:18:02 AM5/16/16
to datameet
Hi Shantanu,
Thanks! I'll save these snippets in my folder
Might we have similar solutions for efficiently listing and
individually/bulk editing a database table's entries on a webpage?
(similar to how one manages an email inbox)
> --
> Datameet is a community of Data Science enthusiasts in India. Know more about us by visiting http://datameet.org
> ---
> You received this message because you are subscribed to the Google Groups "datameet" group.
> To unsubscribe from this group and stop receiving emails from it, send an email to datameet+u...@googlegroups.com.
>
> For more options, visit https://groups.google.com/d/optout.
Thanks! I'll save these snippets in my folder
Might we have similar solutions for efficiently listing and
individually/bulk editing a database table's entries on a webpage?
(similar to how one manages an email inbox)
> Datameet is a community of Data Science enthusiasts in India. Know more about us by visiting http://datameet.org
> ---
> You received this message because you are subscribed to the Google Groups "datameet" group.
> To unsubscribe from this group and stop receiving emails from it, send an email to datameet+u...@googlegroups.com.
>
> For more options, visit https://groups.google.com/d/optout.
Reply all
Reply to author
Forward
0 new messages