Problem with Ordinal scales that is stumping me
27 views
Skip to first unread message

Thomas Bolioli
Mar 29, 2018, 6:27:47 PM3/29/18
to d3-js
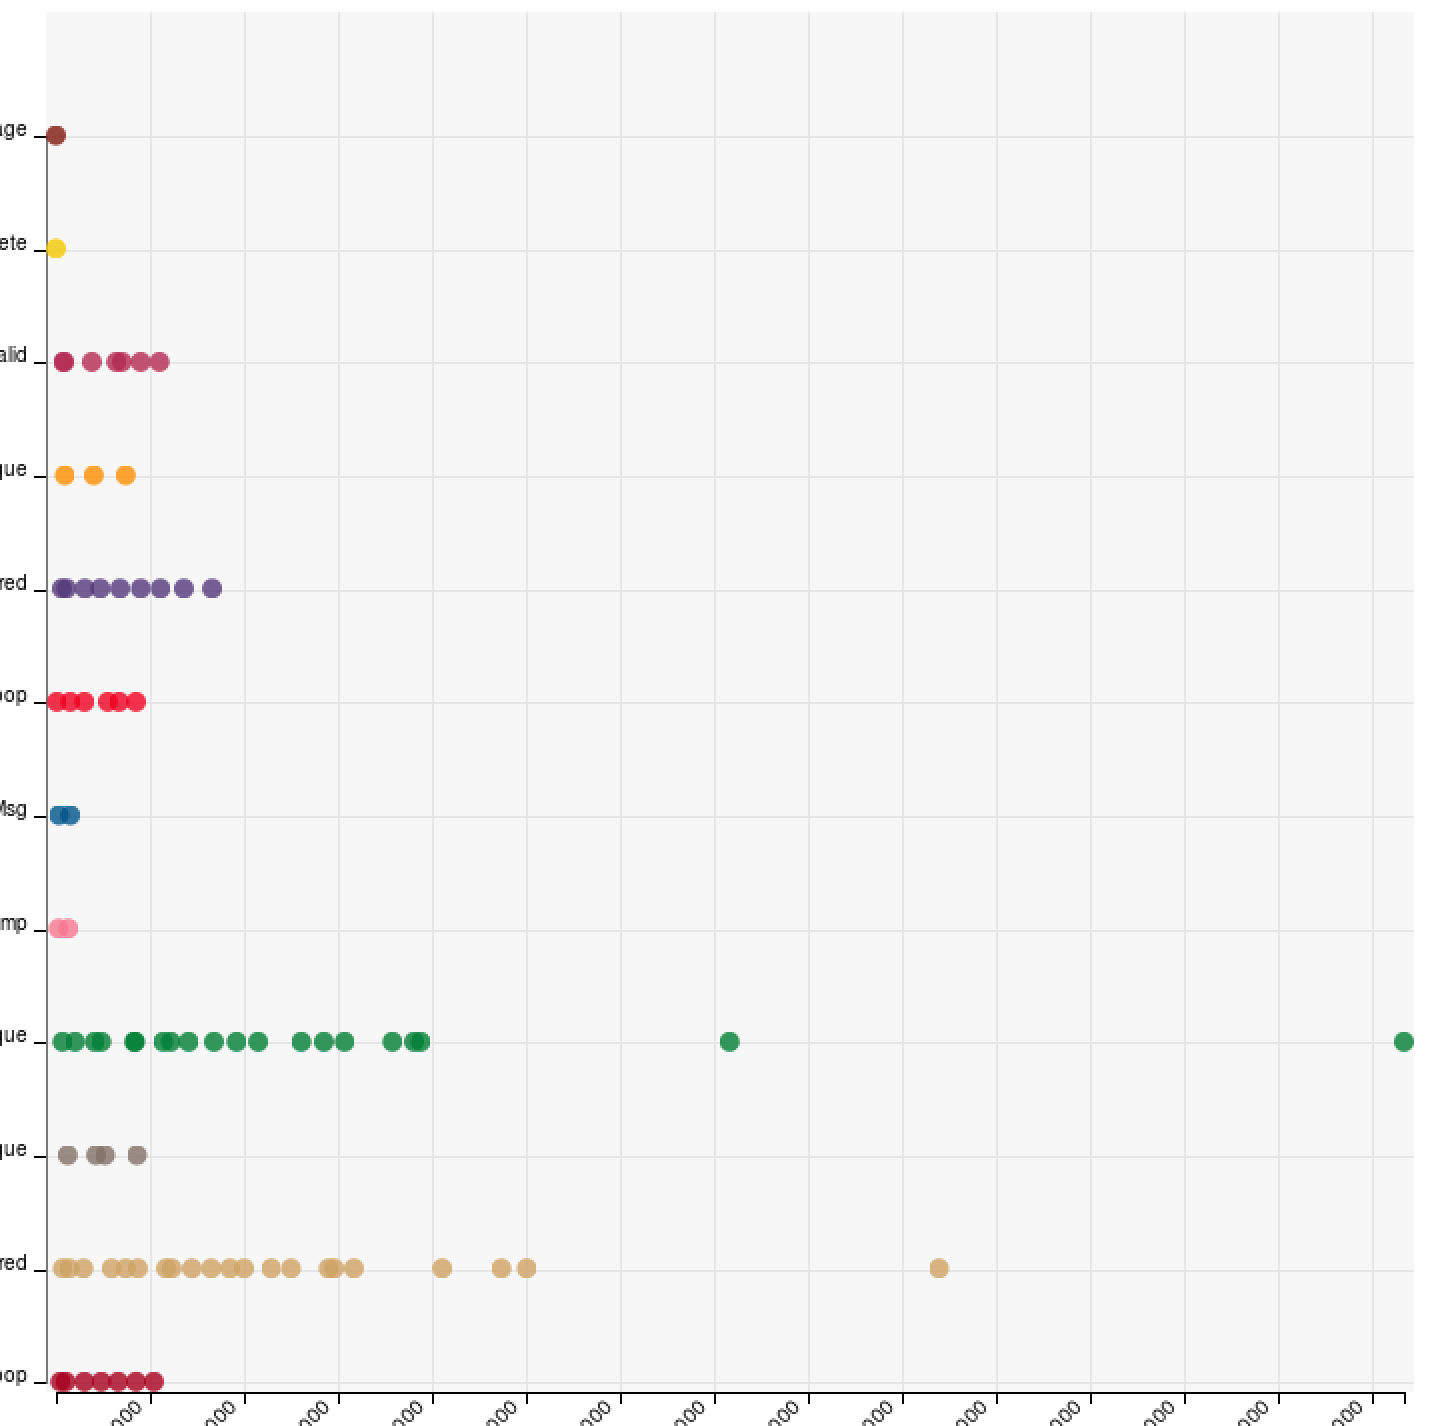
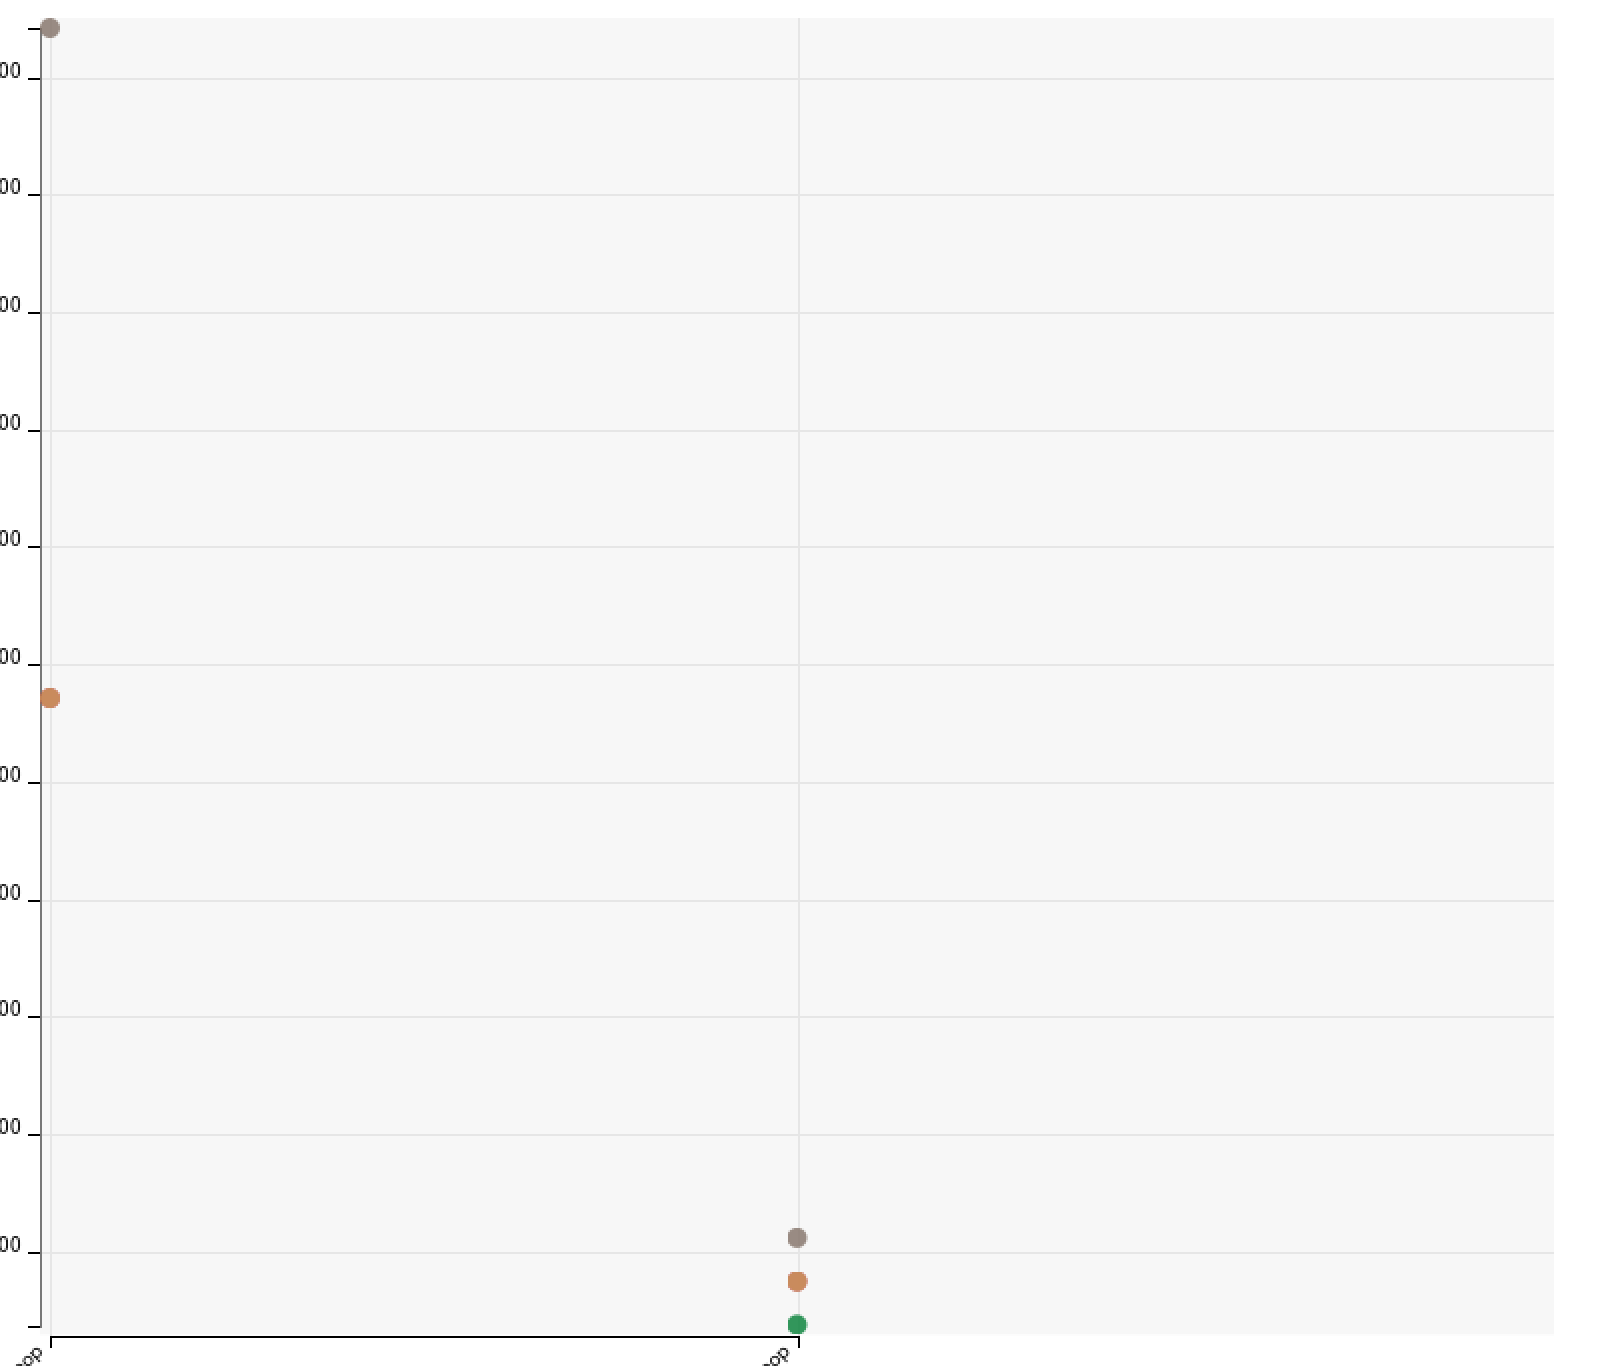
See attached for what the graphs look like. This problem occurs only on ordinal axes. Yet, D3 plots all of the values in a shorter length axis by the width of the gap between 2 points. I can't provide a test case as if I could isolate it, I would likely find the problem. This is coming out of a very large D3 based code base (10K lines+) and I can't isolate code easily. The images show the trailing gap at the end of the axis.
Here is the code that I believe is causing the issue, but again, the problem escapes me. The domain is correct array of all ordinal values. The range is also correct equalling the height/width of the canvas.
var domain_size = domain.length;
var range_size = range[1] - range[0];
var temp = range_size/domain_size;
var ord_range = d3.range(range[0],range[1], temp);
scale = d3.scaleOrdinal().domain(domain).range(ord_range);
Any ideas on what would cause the graphs that I have included with this?
Thanks,
Tom

Adnan Salahuddin
Mar 30, 2018, 1:02:41 AM3/30/18
to d3...@googlegroups.com
Hi,
I am learning new D3 so i cannot help you. Sorry
--
You received this message because you are subscribed to the Google Groups "d3-js" group.
To unsubscribe from this group and stop receiving emails from it, send an email to d3-js+unsubscribe@googlegroups.com.
For more options, visit https://groups.google.com/d/optout.
Best Wishes,
Adnan SalahuddinGmail: adnan....@gmail.com
Hotmail: adnan_...@hotmail.com
Twitter: @adnan_salah84

Kai Chang
Mar 30, 2018, 1:48:56 AM3/30/18
to d3...@googlegroups.com
Is it only a problem with ordinal scales on the X axis? The first image with the ordinal scale on the Y axis looks good. Having worked on these types of codebases, it's possible that dozens, hundreds or even thousands of lines in the visualization code base are dedicated to handling special cases on the X and Y axes. In that case, it can take some painstaking debugging to sort out what's going on when.
Also scalePoint can do this for you instead of scaleOrdinal. The point scale will handle the bit that you've calculated with temp and ord_range, it just needs the domain array and canvas size.
https://github.com/d3/d3-scale#scalePoint
Also scalePoint can do this for you instead of scaleOrdinal. The point scale will handle the bit that you've calculated with temp and ord_range, it just needs the domain array and canvas size.
https://github.com/d3/d3-scale#scalePoint
Message has been deleted
Thomas Bolioli
Apr 2, 2018, 11:52:15 AM4/2/18
to d3-js
That did it. I don't know why the scaleOrdinal method didn't work, but scalePoint() did exactly what I wanted.
Thanks,
Tom
On Friday, March 30, 2018 at 1:48:56 AM UTC-4, Kai Chang wrote:
Is it only a problem with ordinal scales on the X axis? The first image with the ordinal scale on the Y axis looks good. Having worked on these types of codebases, it's possible that dozens, hundreds or even thousands of lines in the visualization code base are dedicated to handling special cases on the X and Y axes. In that case, it can take some painstaking debugging to sort out what's going on when.
Also scalePoint can do this for you instead of scaleOrdinal. The point scale will handle the bit that you've calculated with temp and ord_range, it just needs the domain array and canvas size.
https://github.com/d3/d3-scale#scalePoint
On Thu, Mar 29, 2018 at 10:02 PM, Adnan Salahuddin <adnan....@gmail.com> wrote:
Hi,I am learning new D3 so i cannot help you. Sorry
On Fri, Mar 30, 2018 at 3:27 AM, Thomas Bolioli <tbol...@gmail.com> wrote:
See attached for what the graphs look like. This problem occurs only on ordinal axes. Yet, D3 plots all of the values in a shorter length axis by the width of the gap between 2 points. I can't provide a test case as if I could isolate it, I would likely find the problem. This is coming out of a very large D3 based code base (10K lines+) and I can't isolate code easily. The images show the trailing gap at the end of the axis.Here is the code that I believe is causing the issue, but again, the problem escapes me. The domain is correct array of all ordinal values. The range is also correct equalling the height/width of the canvas.var domain_size = domain.length;var range_size = range[1] - range[0];var temp = range_size/domain_size;var ord_range = d3.range(range[0],range[1], temp);scale = d3.scaleOrdinal().domain(domain).range(ord_range);Any ideas on what would cause the graphs that I have included with this?Thanks,Tom
--
You received this message because you are subscribed to the Google Groups "d3-js" group.
To unsubscribe from this group and stop receiving emails from it, send an email to d3-js+un...@googlegroups.com.
For more options, visit https://groups.google.com/d/optout.
--Best Wishes,Adnan SalahuddinGmail: adnan....@gmail.comHotmail: adnan_...@hotmail.comTwitter: @adnan_salah84
--
You received this message because you are subscribed to the Google Groups "d3-js" group.
To unsubscribe from this group and stop receiving emails from it, send an email to d3-js+un...@googlegroups.com.
Kai Chang
Apr 3, 2018, 10:03:22 AM4/3/18
to d3...@googlegroups.com
The bug in the original is possibly in the line using d3.range. The stop value is exclusive, so you won't see range[1] in the output array ord_range. Anyways, glad using scalePoint fixed it.
To unsubscribe from this group and stop receiving emails from it, send an email to d3-js+unsubscribe@googlegroups.com.
Reply all
Reply to author
Forward
0 new messages