Linechart missing data
17 views
Skip to first unread message

Mike H
Oct 16, 2017, 10:39:06 PM10/16/17
to d3-js
Hello,
I am new to D3 but making progress.
Does anyone know how to make a line chart with non-consistent data?
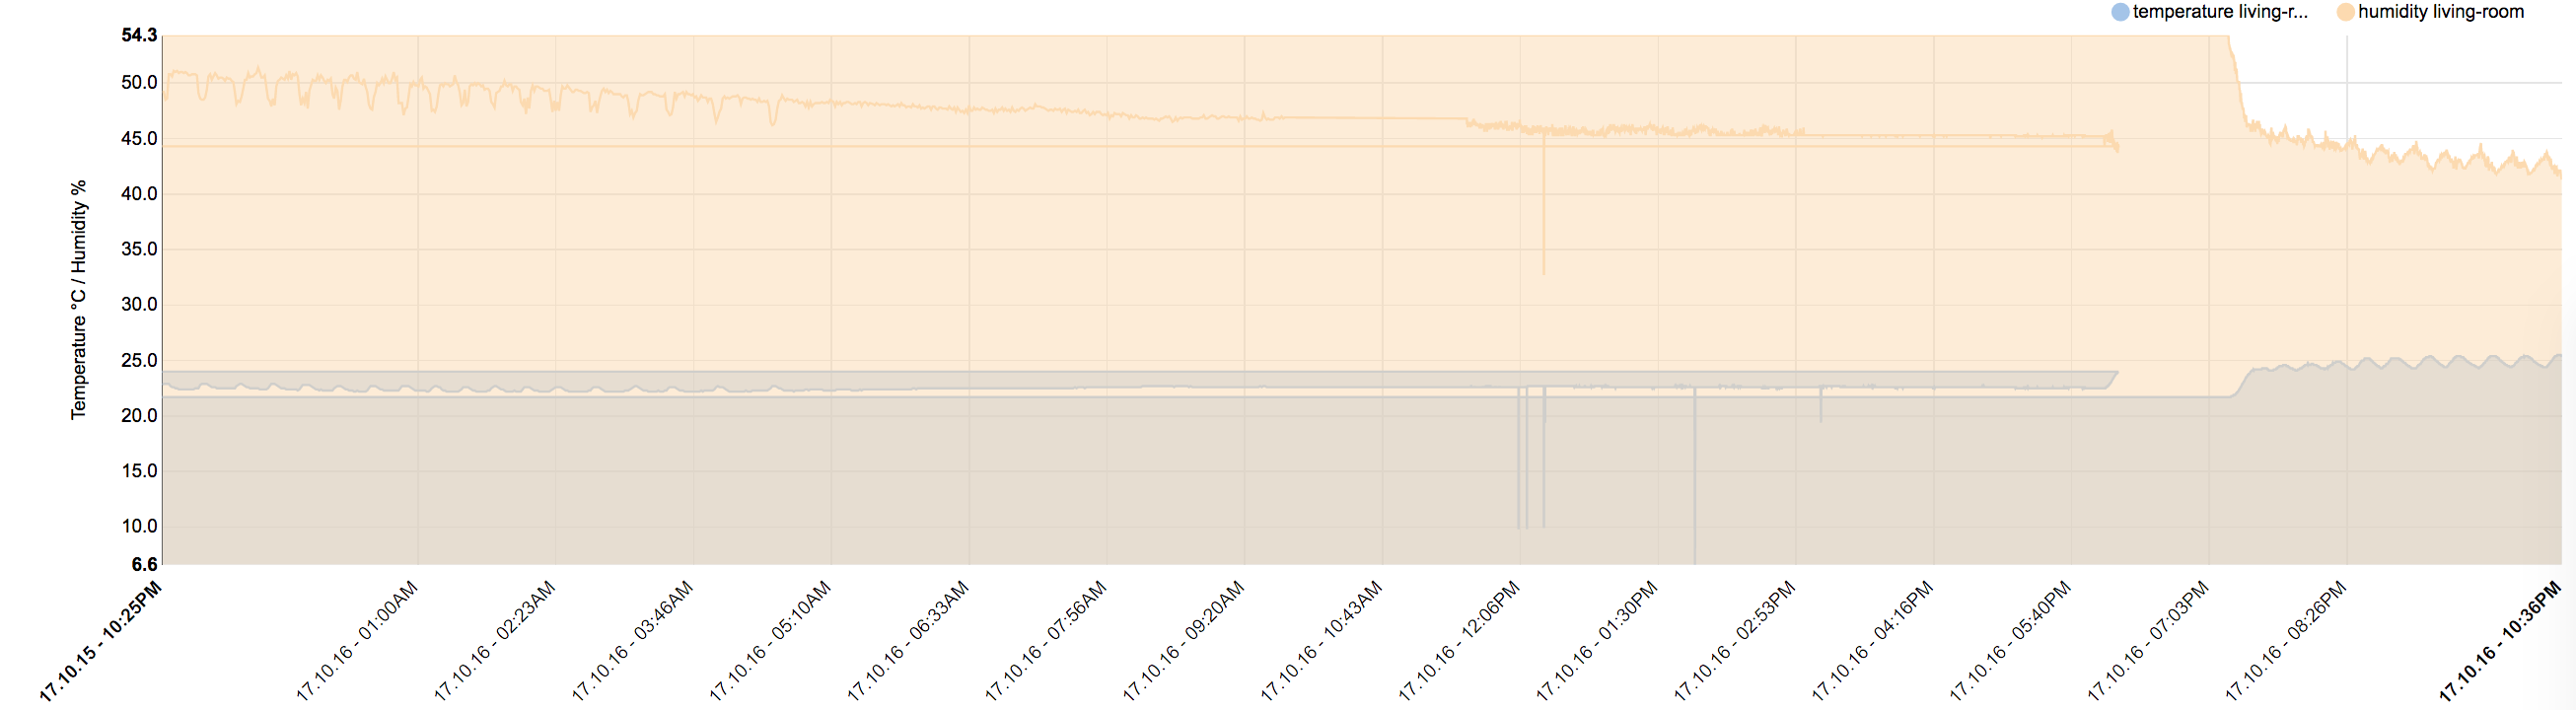
See the attached screen shot.
Near the right side, the Server/Sensor wasn't collecting data, so the CSV file just doesn't have any values. None.
Anyone know why it's rendering this way?
Thanks!
I am new to D3 but making progress.
Does anyone know how to make a line chart with non-consistent data?
See the attached screen shot.
Near the right side, the Server/Sensor wasn't collecting data, so the CSV file just doesn't have any values. None.
Anyone know why it's rendering this way?
Thanks!

Gordon Woodhull
Oct 17, 2017, 12:48:32 AM10/17/17
to d3...@googlegroups.com
It looks like, instead of skipping that data, it's filled in with points at Time Zero, like 1/1/1970 or whatever. So you get an area that intersects itself, causing those weird shapes.
You could try setting area.defined with a predicate function d3 can use to detect whether to skip those data points:
--
You received this message because you are subscribed to the Google Groups "d3-js" group.
To unsubscribe from this group and stop receiving emails from it, send an email to d3-js+un...@googlegroups.com.
For more options, visit https://groups.google.com/d/optout.
<Screen Shot 2017-10-16 at 10.36.55 PM.png>
Mike H
Oct 17, 2017, 7:51:54 AM10/17/17
to d3-js
Gordon,
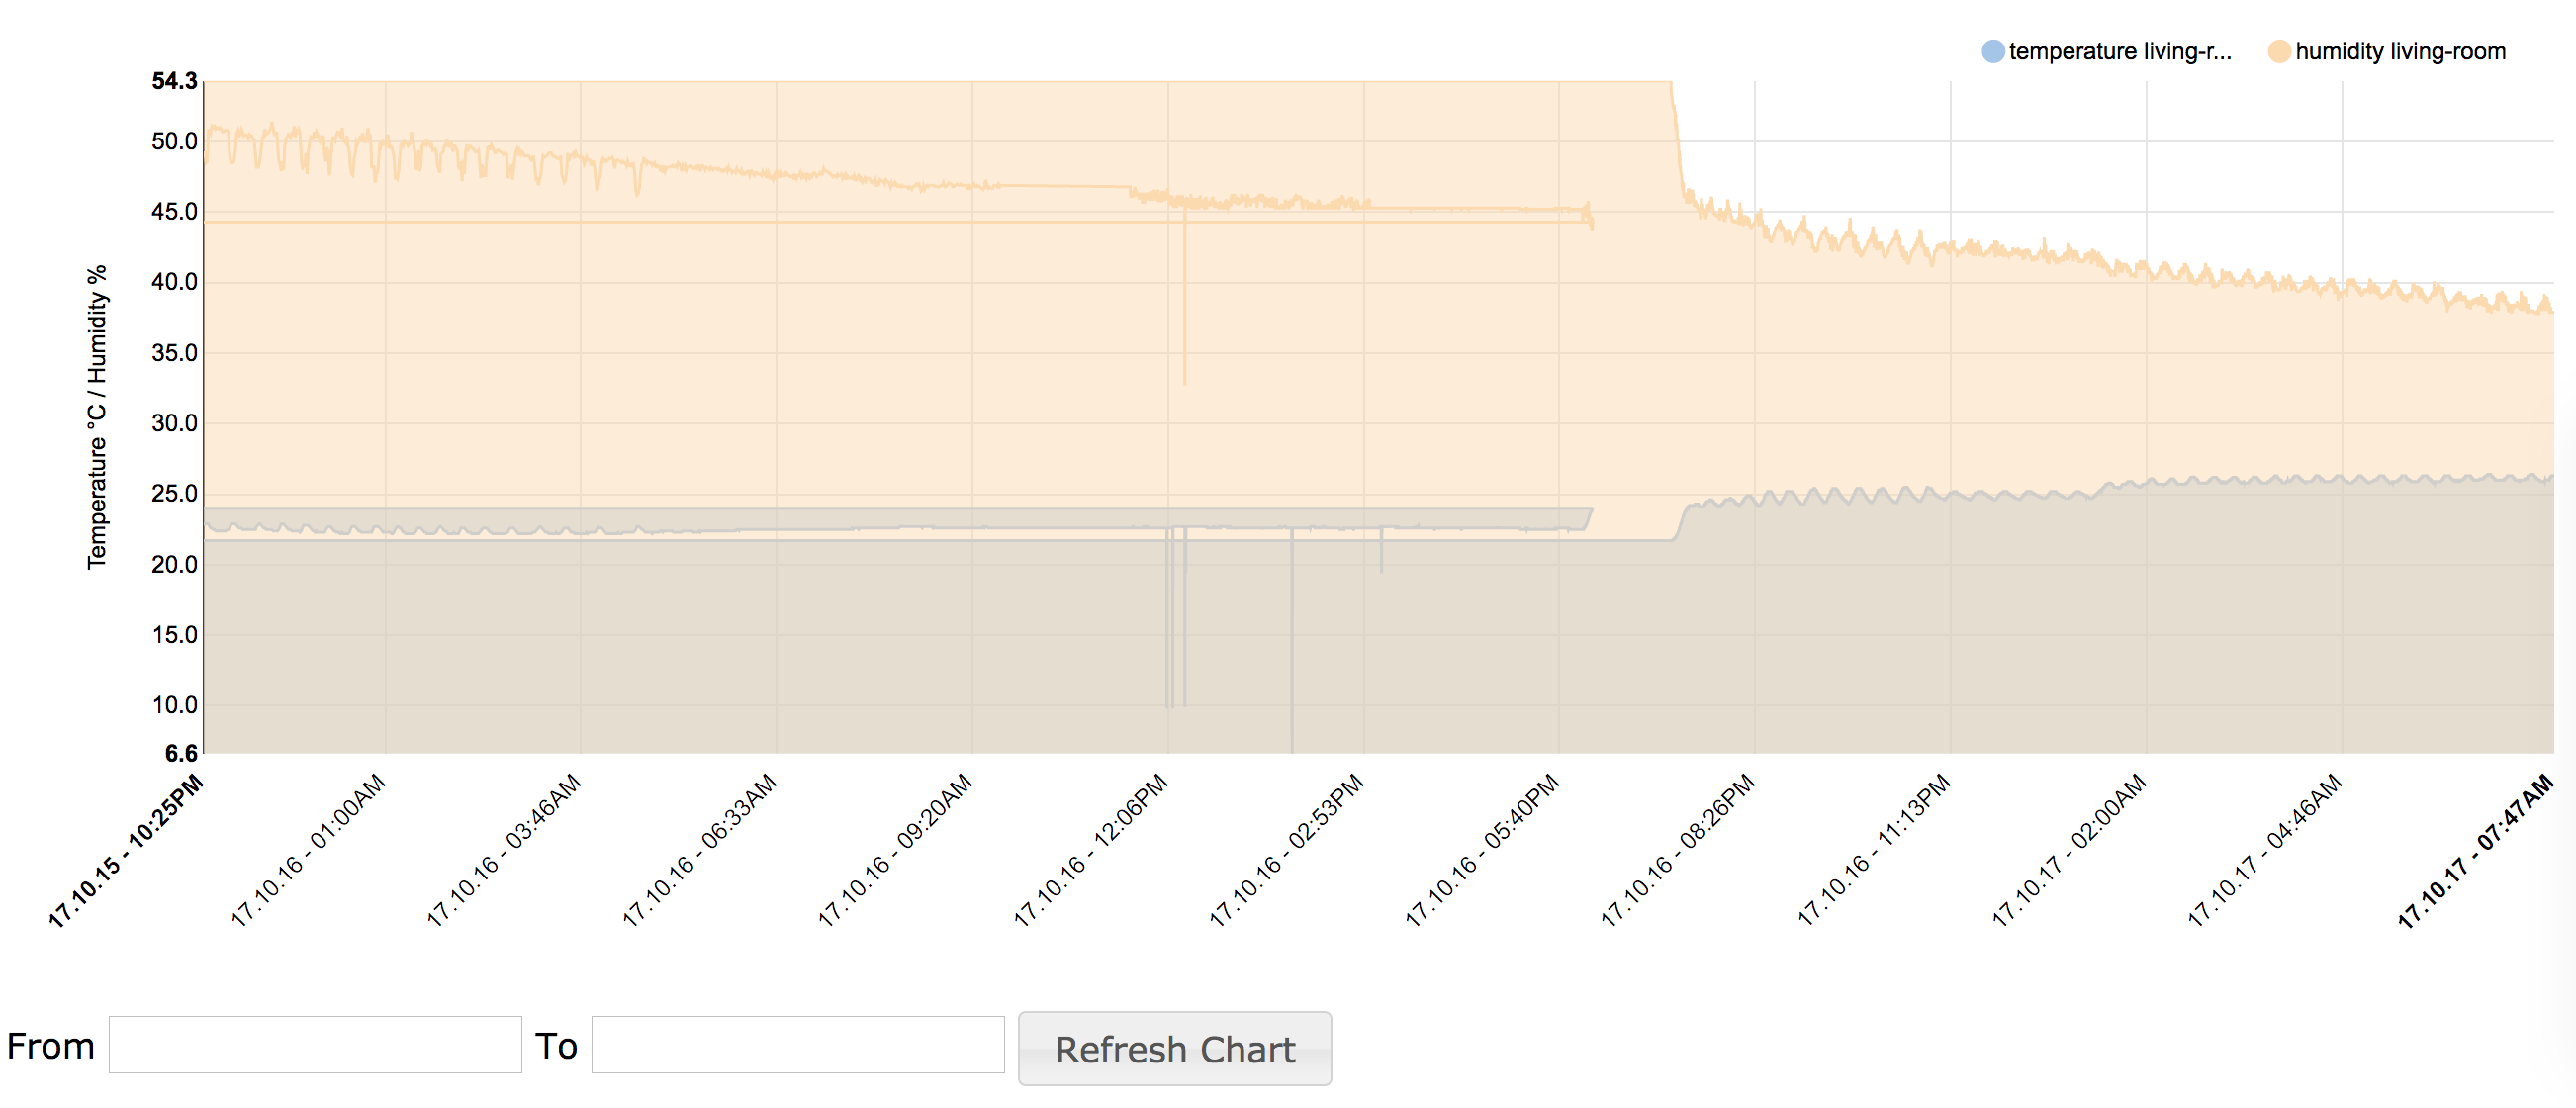
I found out that displaying just ONE day, or some time range actually fixes the display problem.
See the attached screen caps for a better explanation.
Any ideas? Before upgrading to the latest D3, it would render WAY off the left side too.
I found out that displaying just ONE day, or some time range actually fixes the display problem.
See the attached screen caps for a better explanation.
Any ideas? Before upgrading to the latest D3, it would render WAY off the left side too.
Reply all
Reply to author
Forward
0 new messages