D3 js - Circle spoke diagram - to embed in Angular JS
262 views
Skip to first unread message

venuwe...@gmail.com
Jun 17, 2016, 2:59:03 AM6/17/16
to d3-js
Hi everyone,
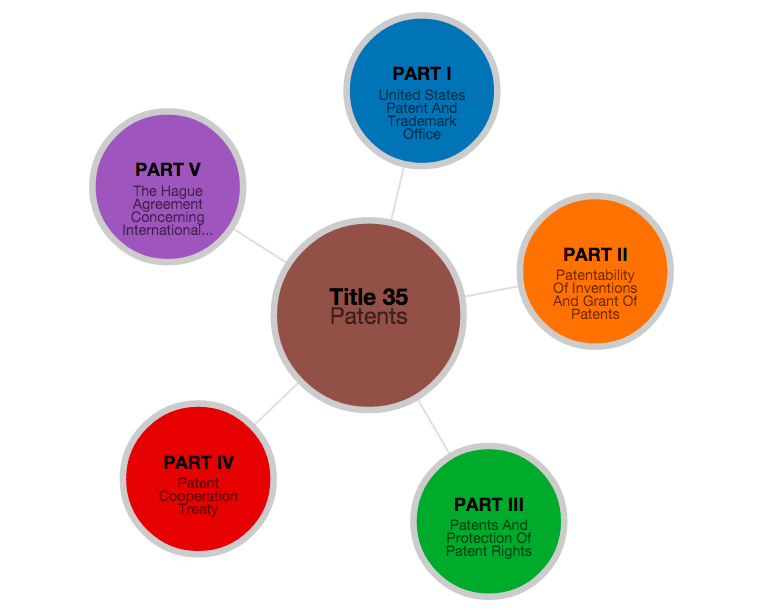
I need circle spoke digram with d3 js. I want to add that in angular js application. Based on Json file data, Diagram has to draw. I dont require any animations and easing effects. Please help
Find the attached diagram. Please help.
I got one source code for this , But iam unable to remove the animation and easing effect. I need just static diagram.
Source Code:
var width = 960,
height = 600,
root;
var force = d3.layout.force()
.linkDistance(200)
.charge(-200)
.gravity(0)
.size([width, height])
.on("tick", tick);
var svg = d3.select("svg").append("svg")
.attr("width", width)
.attr("height", height);
var link = svg.selectAll(".link"),
node = svg.selectAll(".node");
d3.json("graph.json", function(error, json) {
root = json;
update();
});
function update() {
var nodes = flatten(root),
links = d3.layout.tree().links(nodes);
// Restart the force layout.
force
.nodes(nodes)
.links(links)
.start();
// Update links.
link = link.data(links, function(d) { return d.target.id; });
link.exit().remove();
link.enter().insert("line", ".node")
.attr("class", "link");
// Update nodes.
node = node.data(nodes, function(d) { return d.id; });
node.exit().remove();
var nodeEnter = node.enter().append("g")
.attr("class", "node")
.on("click", click)
.call(force.drag)
.attr("href", function(d) { return d.link; });
nodeEnter.append("svg:a")
.attr("xlink:href", function(d){return d.link;})
.append("circle")
.attr("r", function(d) { return Math.sqrt(d.size) / 10 || 4.5; });
nodeEnter.append("text")
.attr("dy", ".35em")
.text(function(d) { return d.name; });
node.select("circle")
.style("fill", color);
}
function tick() {
link.attr("x1", function(d) { return d.source.x; })
.attr("y1", function(d) { return d.source.y; })
.attr("x2", function(d) { return d.target.x; })
.attr("y2", function(d) { return d.target.y; });
node.attr("transform", function (d) { return "translate(" + d.x + "," + d.y + ")"; });
node.forEach(function (d) {
if (d._children || d.children) {
d.x = width / 2, d.y = height / 2;
d.fixed = true;
}
});
}
function color(d) {
return d._children ? "#3182bd" // collapsed package
: d.children ? "#2F9BC1" // expanded package
: "#fd8d3c"; // leaf node
}
// Toggle children on click.
function click(obj) {
if (d3.event.defaultPrevented) return; // ignore drag
if (d.children) {
d._children = d.children;
d.children = null;
} else {
d.children = d._children;
d._children = null;
}
update();
}
// Returns a list of all nodes under the root.
function flatten(root) {
var nodes = [], i = 0;
function recurse(node) {
if (node.children) node.children.forEach(recurse);
nodes.push(node);
}
recurse(root);
return nodes;
}
Json file Example:
{
"name": "Parent", "size": 200000, "link": "http://google.com",
"children": [
{"name": "Child 01", "size": 150000, "link": "http://google.com"},
{"name": "Child 02", "size": 150000, "link": "http://yahoo.com"},
{"name": "Child 03", "size": 150000, "link": "http://youtube.com"},
{"name": "Child 04", "size": 150000, "link": "http://twitter.com"},
{ "name": "Child 05", "size": 150000, "link": "http://facebook.com" },
{"name": "Child 06", "size": 150000, "link": "http://facebook.com"}
]
}

Frank Guerino
Jun 30, 2016, 10:51:38 PM6/30/16
to d3...@googlegroups.com
Hi,
I would suggest that one way to deal with this is to create a pie chart as your invisible template.
I would start by drawing a pie chart (using a Pie Layout) with 5 slices/arcs (because your example has 5 outer Nodes).
- You can start with yellow fill and blue borders as a means of seeing what you're drawing. However, you'll eventually want a white fill and white borders to make it appear invisible... so that only your circles and spokes will be seen (later).
- The data to drive the Pie Layout might look something like:
var dataSet = [ {"nodeLabel":"Node Label One", "magnitude":20}, {"nodeLabel":"Node Label Two", "magnitude":20},":"Node Label Five", "magnitude":20}];
{"nodeLabel":"Node Label Three", "magnitude":20},
{"nodeLabel":"Node Label Four", "magnitude":20},
{"nodeLabel
I would then draw lines to create the spokes...
- One for each spoke
- All with a length equal to the radius of the pie
- Each with an origin that starts at the center of the pie and an end point at the center of each outer pie arc (draw them in grey). These spokes will cut through the middle of each pie slice (appearing to cut each slice in half).
I would then draw circles for all Nodes... (NOTE: Circles after the lines so that the lines are behind the circles.)
- One circle placed in the center
- One circle for each Node, placed at the end of each spoke line
You can then add things like text, colors, links, etc. to each circular Node.
Some examples that might help...
In this Radial Hub and Spoke Browser, you can see how each slice is equal sized (driven from data). This example, also shows how to calculate the center of the slice/arc, as the text is aligned with and placed along those centers.In this simple Pie Chart example, you can imagine that the arcs would all be the same width and that the text placed outside the arcs would be the text for the outer Nodes. NOTE: In this example, you can simply set the magnitudes in the dataSet all to the same value.
This simple Venn Diagram will help you understand how to draw the circles and their placement.
I hope this helps,
Frank
--
You received this message because you are subscribed to the Google Groups "d3-js" group.
To unsubscribe from this group and stop receiving emails from it, send an email to d3-js+un...@googlegroups.com.
For more options, visit https://groups.google.com/d/optout.
Reply all
Reply to author
Forward
0 new messages