How to draw dropdown sidebar of tasks in a gantt chart ??
56 views
Skip to first unread message

Chandrasekhar Anem
May 25, 2016, 3:12:24 AM5/25/16
to d3-js
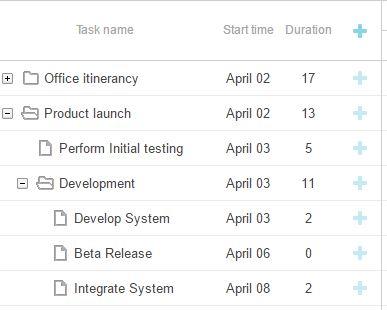
I have created simple gantt chart with dependencies , Indicating sub-tasks on y-axis but i don't know how to show main tasks like above image on gantt chart.
Data which i have passed to gantt is a list of objects. i.e [{taskname,enddate,startdate}{}{}{}]
Any help is appreciable. Thanks

Tito
May 26, 2016, 9:57:41 AM5/26/16
to d3-js
please manually draw out your Gantt chart and post image of what the final Gantt would look like
Chandrasekhar Anem
May 26, 2016, 10:05:20 AM5/26/16
to d3...@googlegroups.com
--
You received this message because you are subscribed to a topic in the Google Groups "d3-js" group.
To unsubscribe from this topic, visit https://groups.google.com/d/topic/d3-js/_wh_qKReFyo/unsubscribe.
To unsubscribe from this group and all its topics, send an email to d3-js+un...@googlegroups.com.
For more options, visit https://groups.google.com/d/optout.
Tito
May 26, 2016, 11:32:46 AM5/26/16
to d3-js
that does not look like a Gantt chart. that look like a screen shot of another tool. where are the x and y acis in this.
please post an image of what the gantt chart should look like
please post an image of what the gantt chart should look like
Tito
May 26, 2016, 12:11:01 PM5/26/16
to d3-js
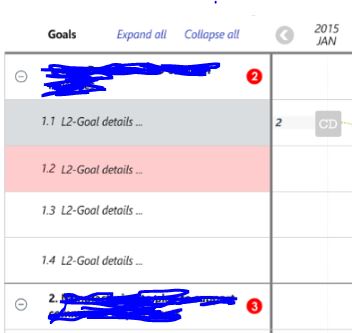
ok this helps a little bit. now please explain how the list on the left interacts with the Gantt chart on the right. what is the relationship between the two? What is your expectation of this tool. please explain fully ?
Chandrasekhar Anem
May 26, 2016, 12:49:08 PM5/26/16
to d3-js
X axis and Y axis were related by List of Objects
i.e [Object, Object, Object, Object, Object, Object, Object, Object, Object, Object, Object, Object, Object, Object, Object, Object, Object, Object, Object, Object, Object, Object, Object, Object]. Inside each object consists { taskname,enddate,startdate,status } by using that both axis and rectangles were built. on top of tasknames i want to place another
Main task. Right now i am passing data in this format [{}{}{}{}] but i want to know how to place main task. Please help?? Deadlines is very near.
Tito
May 26, 2016, 3:53:53 PM5/26/16
to d3-js
deadline can be met if you answered the questions you are being asked. how does left list interact with Gantt on right side. Help us help you.
Message has been deleted
Chandrasekhar Anem
May 27, 2016, 1:55:34 AM5/27/16
to d3-js
- [Object, Object, Object, Object, Object, Object, Object, Object, Object, Object, Object, Object, Object, Object, Object, Object, Object, Object, Object, Object, Object, Object, Object, Object]
- 0:Object
- Domain:"CD"
- endDate:Thu Dec 31 2015 00:00:00 GMT+0530 (India Standard Time)
- startDate:Tue Dec 01 2015 00:00:00 GMT+0530 (India Standard Time)
- status:"critical"
- taskName:"L2-Goals"
var taskStatus = { "future" : "bar-future", "completed" : "bar-completed", "critical" : "bar-critical"};
Following code is used in creating gantt ...
d3.ganttL2 = function() {
var FIT_TIME_DOMAIN_MODE = "fit";
var FIXED_TIME_DOMAIN_MODE = "fixed";
var margin = {
top : 50,
right : 40,
bottom : 20,
left : 150
};
var timeDomainMode = FIT_TIME_DOMAIN_MODE; // fixed or fit
var taskTypes = [];
var taskStatus = [];
var height = document.body.clientHeight - margin.top - margin.bottom-5;
var width = document.body.clientWidth - margin.right - margin.left-5;
var tickFormat = "%b";
var keyFunction = function(d) {
return d.startDate + d.taskName + d.endDate;
};
var rectTransform = function(d) {
return "translate(" + x(d.startDate) + "," + y(d.taskName) + ")";
};
var textTransform = function(d) {
return "translate(" + x(d.startDate) + 4 +"," + y(d.taskName) + ")";
};
var initTimeDomain = function() {
if (timeDomainMode === FIT_TIME_DOMAIN_MODE) {
tasks.sort(function(a, b) {
return a.startDate - b.startDate;
});
timeDomainStart = d3.time.day.offset(new Date(),-180);
tasks.sort(function(a, b) {
return a.endDate - b.endDate;
});
timeDomainEnd = d3.time.day.offset(new Date(),+300);
}
};
var initAxis = function() {
x = d3.time.scale().domain([timeDomainStart, timeDomainEnd ]).range([ 12, width ]).clamp(true).nice(d3.time.month);
y = d3.scale.ordinal().domain(taskTypes).rangeRoundBands([ 0, height - margin.top - margin.bottom ], .25);
xAxis = d3.svg.axis().scale(x).orient("top").tickFormat(d3.time.format(tickFormat))
.tickSize(1).tickPadding(10);
// .tickSize(-height + 60, 0, 00).ticks(d3.time.months)
yAxis = d3.svg.axis().scale(y).orient("left").tickSize(0).tickPadding(5);
};
function gantt(tasks) {
initTimeDomain();
initAxis();
var svg = d3.select("body")
.append("svg")
.attr("class", "chart") // For styling of chart
.attr("width", width + margin.left + margin.right)
.attr("height", height)
.append("g")
.attr("class", "gantt-chart")
.attr("width", width + margin.left + margin.right)
.attr("height", height + margin.top + margin.bottom)
.attr("transform", "translate(" + margin.left + ", " + margin.top + ")");
var chart_rect = svg.selectAll(".chart")
.data(tasks, keyFunction)
.enter()
.append("rect")
.attr("rx", 5)
.attr("ry", 1.5)
.attr('id',function(d) {
return d.Milestone_Id
})
.on('mouseover',function(d){
mouseover_gantt(d,d3.select(this).data()[0])
})
.on('mouseout', function() {
mouseout_gantt();
})
.attr("class", function(d){
if(taskStatus[d.status] == null){ return "bar-future";}
return taskStatus[d.status];
})
.attr("y", 10)
.attr("x",0)
.attr("transform", rectTransform)
.attr("height", function(d) { return y.rangeBand(); })
.attr("width", function(d) {
return (x(d.endDate) - x(d.startDate));
});
svg.selectAll(".line")
.data(tasks, keyFunction)
.enter()
.append("line")
.attr('class','line')
.style("stroke-dasharray", ("3, 3"))
.attr('x1',function(d){ if(d.Pre_milestone_ID != ""){
if (d.TypeOfDependency == "SF"){
return x(d.startDate)
}
else {
return x(d.endDate)-32
}
}
else {
return ""
} })
.attr('y1',function(d){
if(d.Pre_milestone_ID != ""){
return y(d.taskName)+22
} else {
return ""}
})
.attr('x2',function(d){
if(d.Pre_milestone_ID != ""){
var task1 = _.where(tasks, {'Milestone_Id':d.Pre_milestone_ID})
return x(task1[0].startDate)
}
else {return ""}
})
.attr('y2',function(d){
if(d.Pre_milestone_ID != ""){
var task1 = _.where(tasks, {'Milestone_Id':d.Pre_milestone_ID})
return y(task1[0].taskName)+22
}
else {return ""}
})
.attr('stroke','#77b300')
.attr('stroke-width',2)
var svg_text = svg.selectAll("text")
.data(tasks, keyFunction)
.enter()
.append("text")
.text(function(d){ return d.Domain})
.attr("transform", textTransform)
.attr('y',27)
.attr('x',2.5)
.attr('fill','white')
.attr("font-family","Century")
.attr("font-size", "14")
.on('mouseover',function(d){
mouseover_gantt(d,d3.select(this).data()[0])
})
.on('mouseout', function() {
mouseout_gantt();
})
svg.append("g")
.attr("class", "x axis")
.attr("transform", "translate(12, 0)")
.transition()
.call(xAxis);
var g1 = svg.append("g").attr("class", "y axis").attr("transform","translate(0,0)")
g1.attr("transform",'translate(0,10)')
g1.call(yAxis);
return gantt;
};
d3.select('.tick').select("text").attr('fill','red')
};
};
Tito
May 27, 2016, 12:46:07 PM5/27/16
to d3-js
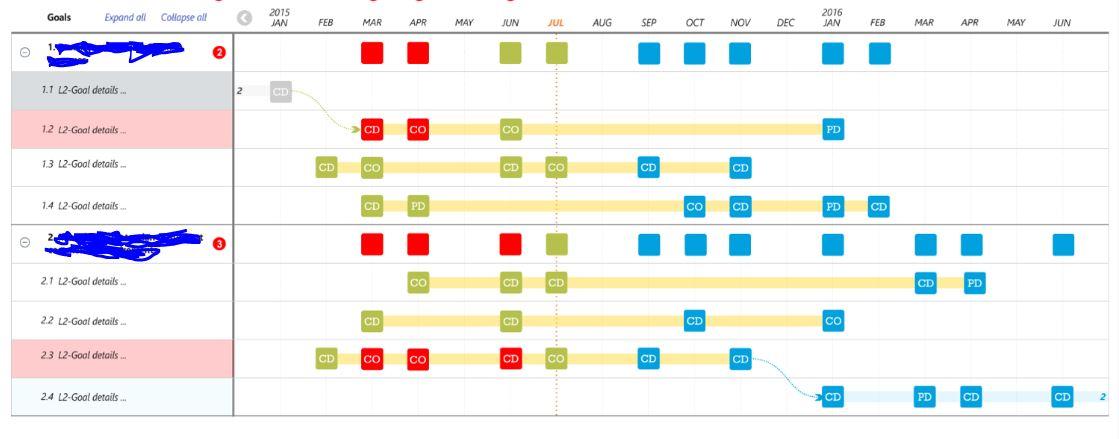
ok so I think I see what you want. this is like a layered chart with collapsing list on the left. each left side list has a corresponding Gantt chart. Ok so now more questions. What is d3.ganttL2 ? and how is it being called, if it is a function?
can you at least show us a working code of this below Gantt Chart, the Gantt chart part only, one simple Gantt Chart, without the list on the left, on http://plnkr.co/?
Reply all
Reply to author
Forward
0 new messages