One question about axis
12 views
Skip to first unread message

Flash Zone
Jul 29, 2015, 11:23:41 AM7/29/15
to d3-js
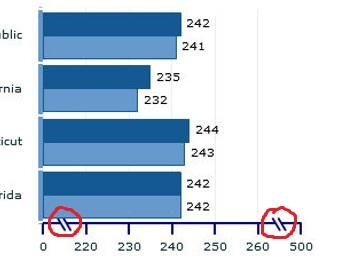
I met a problem about axis label. At x axis, my range is from 0-500, but all data are between 220-260. On my chart x axis, I need display from 0-500, but main range is 220-260. So range 0-220 and 260-500 will be ignored but showed on axis. Please see my attached picture. Is there a D3 function of axis I can directly use? Or any ideas/suggestions. Thanks a million!

Max Goldstein
Jul 31, 2015, 10:15:54 AM7/31/15
to d3-js, flas...@gmail.com
No, there's not a d3 function that will draw this for you (that I know of). You can look into polylinear scales, but I don't think there's a corresponding axis implementation.
But, why are you doing this in the first place? Truncating the axis for bar charts is a horrible thing to do. If you want to see the differences between the bars, use a line plot, and you don't need to even show where zero is on the axis.
Flash Zone
Jul 31, 2015, 11:04:47 AM7/31/15
to d3-js, flas...@gmail.com, maxgol...@gmail.com
Thanks Max! I will take a look on polylinear scales. The clients need both bars and lines on this project. They need to show axis like that.
Reply all
Reply to author
Forward
0 new messages