d3 js Grouped Bar Chart - Showing Values that are not Present in DB
183 views
Skip to first unread message

VJAY AROCKIASAMY
Apr 19, 2016, 2:01:08 PM4/19/16
to d3-js
Hi,
I am new to d3js.I have a requirement to create the d3js grouped bar chart.
I looked into various examples but they json data that is used for creating grouped bar chart is having values for bot the columns
For Ex:
State,Under 5 Years,5 to 13 Years,14 to 17 Years,18 to 24 Years,25 to 44 Years,45 to 64 Years,65 Years and Over
CA,2704659,4499890,2159981,3853788,10604510,8819342,4114496
TX,2027307,3277946,1420518,2454721,7017731,5656528,2472223
NY,1208495,2141490,1058031,1999120,5355235,5120254,2607672
FL,1140516,1938695,925060,1607297,4782119,4746856,3187797
IL,894368,1558919,725973,1311479,3596343,3239173,1575308
PA,737462,1345341,679201,1203944,3157759,3414001,1910571
My use case is different.
I will not get all the values from database until the particular document is created by the user(data driven).
If I use Inner Join in SQL I will get only the documents and projects that are created for that PAG.
| PAG | DocumentName | Count | |
| Global Banking Tech | Projects | 1 | |
| Global Banking Tech | High Level Design | 1 |
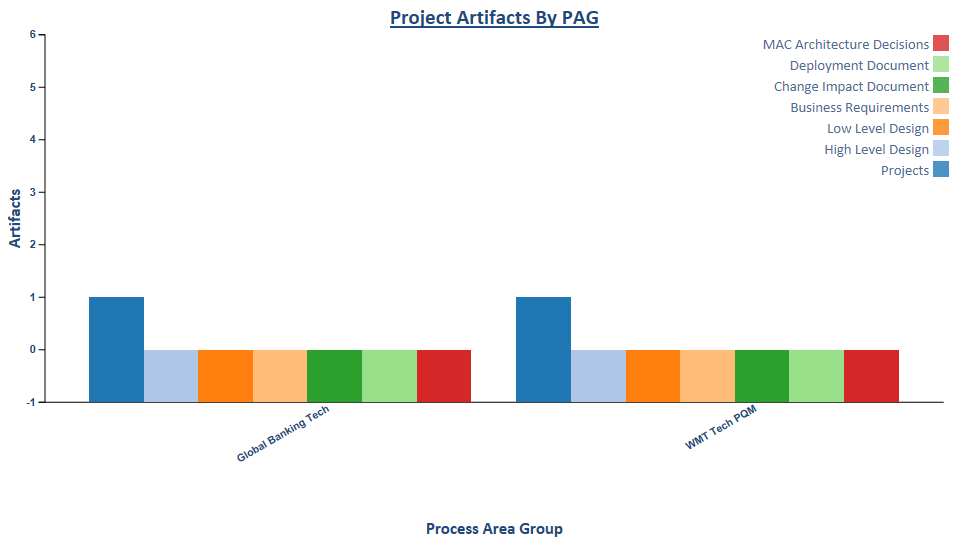
But Management wants to show all the documents and put 0 for the document templates that are not created so far by the users.
So I used left outer join and got the results for all the document templates. I need to display the values with 0 documents in the Grouped bar chart.
y.domain([-1,d3.max(data, function (d) { return d3.max(d.ages, function (d) { return d.value; }); })+5]).nice().range([height - padding, 0]);
When the documents count is increased for ex to 14 for High level Design automatically -1 is changed to -2(I mean the graph is starting from -2).I don't know why this is happening.
But starting the y axis from -1 for documents and projects count is little odd and is there a better way to achieve this for the values that are not populated by the users in DB.
Please find the attached sample bar chart for your reference.
PAG DocumentName Count
Global Banking Tech Projects 1
Global Banking Tech High Level Design 0
Global Banking Tech Low Level Design 0
Global Banking Tech Business Requirements 0
Global Banking Tech Change Impact Document 0
Global Banking Tech Deployment Document 0
Global Banking Tech MAC Architecture Decisions 0
Global Banking Tech Projects 1
Global Banking Tech High Level Design 0
Global Banking Tech Low Level Design 0
Global Banking Tech Business Requirements 0
Global Banking Tech Change Impact Document 0
Global Banking Tech Deployment Document 0
Global Banking Tech MAC Architecture Decisions 0

Tito
Apr 19, 2016, 8:00:58 PM4/19/16
to d3-js
VJAY AROCKIASAMY
Apr 20, 2016, 8:37:57 AM4/20/16
to d3-js
Hi,
Thanks for the reply.But you are showing Artufacts in the X asix and the Count in the Y axis.But i am creating a Grouped bar chart.Please find the below mentioned code snippet.
Json Array data is similar to the one which you have in your post.I need to show the Documents with Count 0(bars) in the Chart.
Please help.
function dashboard(PAGdetails) {
var test = [];
test = populateJSON(PAGdetails);
var json = JSON.stringify(test);
var data = JSON.parse(json);
var margin = { top: 20, right: 20, bottom: 30, left: 40 },
width = parseInt(d3.select("#chartdiv").style("width")) - margin.left - margin.right,
height = parseInt(d3.select("#chartdiv").style("height")) - margin.top - margin.bottom,
padding = 100;
var barPadding = 1;
//var ageNames = d3.keys(keysLen(data)).filter(function (d) {
// return d != "PAG"
//});
var ageNames = d3.keys(data[0]).filter(function (key) {
return key !== "PAG";
});
var data = (data.sort(function (d) { return d.Count }).filter(function (d) {
return d.PAG !== "NA"
}));
var x0 = d3.scale.ordinal().domain(data.map(function (d) { return d.PAG; }))
.rangeRoundBands([0, width], .1);
//var x0 = d3.scale.ordinal()
// .rangeRoundBands([0, width], .1);
var x1 = d3.scale.ordinal();
var y = d3.scale.linear().range([height, 0]).nice();
var p = d3.scale.category20();
var r = p.range(); // ["#1f77b4", "#ff7f0e", "#2ca02c", "#d62728", "#9467bd",
var color = d3.scale.ordinal().range(r);
var xAxis = d3.svg.axis()
.scale(x0)
.tickSize(0)
//.tickPadding(8)
.orient("bottom");
var yAxis = d3.svg.axis()
.scale(y)
.orient("left")
.tickFormat(d3.format(".0d"));
//var yAxis = d3.svg.axis()
// .scale(y)
// .orient("left")
//.tickFormat(d3.format(".2"));
////add tooltip------------------------------------------------
var tooltip = d3.select("#chartdiv")
.append("div")
.attr("class", "d3-tip")
.style("position", "absolute")
.style("opacity", 0);
var svg = d3.select("#chartdiv").append("svg")
.attr("width", width + margin.left + margin.right)
.attr("height", height + margin.top + margin.bottom)
.append("g")
.attr("transform", "translate(" + margin.left + "," + margin.top + ")");
data.forEach(function (d) {
d.ages = ageNames.map(function (name) {
return { name: name, value: +d[name] };
});
});
x0.domain(data.map(function (d) { return d.PAG; }));
//x0.domain(data.map(function (d) { return d.PAG; })).rangeRoundBands([0, width - padding], .1);
x1.domain(ageNames).rangeRoundBands([0, x0.rangeBand()]);
y.domain([0, d3.max(data, function (d) { return d3.max(d.ages, function (d) { return d.value; }); }) + 5]).nice().range([height - padding, 0]);
var gXAxis = svg.append("g")
.attr("class", "x axis")
.attr("transform", "translate(0," + (height - padding) + ")")
.call(xAxis);
gXAxis.selectAll("text")
.style("text-anchor", "end")
.attr("dx", "-.8em")
.attr("dy", ".15em")
.attr("transform", "translate(" + x1.rangeBand() + ")rotate(-30)");
// xAxis label
svg.append("text")
.attr("transform", "translate(" + (width / 2) + " ," + (height + margin.bottom - 5) + ")")
.style("text-anchor", "middle")
.attr("class", "subtitle")
.text("Process Area Group");
svg.append("g")
.attr("class", "y axis")
.call(yAxis)
.append("text")
.attr("transform", "rotate(-90)")
.attr("x", -(height - padding) / 2)
.attr("y", 0 - margin.left)
//.attr("y", -margin.bottom)
.attr("dy", "1em")
.style("text-anchor", "middle")
.text("Artifacts")
.attr("class", "subtitle");
var PAG = svg.selectAll(".PAG")
.data(data)
.enter().append("g")
.attr("class", "PAG")
.attr("transform", function (d) { return "translate(" + x0(d.PAG) + ",0)"; });
PAG.selectAll("rect")
.data(function (d) {
return d.ages;
})
.enter().append("rect")
.attr("width", x1.rangeBand())
.attr("x", function (d) { return x1(d.name); })
.attr("y", function (d) { return y(d.value); })
.attr("height", function (d) { return height - padding - y(d.value); })
.style("fill", function (d) { return color(d.name); })
.on("mouseover", function (d) {
var pos = d3.mouse(this);
tooltip
.transition()
.duration(500)
.style("opacity", 1);
tooltip.html('<strong>' + d.name + ':' + '</strong>' + '<span style=color:#1F497D>' + d.value + '</span>')
.style("left", d3.event.x + "px")
.style("top", d3.event.y + "px")
})
.on("mouseout", function () {
tooltip.style("opacity", 0);
});
PAG.each(function (data) {
d3.select(this).selectAll("rect")
.on("click", function (drect) {
var PAG = data.PAG;
getpAGDetails(PAG, data);
});
});
addBarLegend(svg, ageNames,width,color,margin);
}
function addBarLegend(svg, ageNames, width, color, margin) {
//Adding Legend for the Grouped Bar Chart
var legend = svg.selectAll(".legend")
.data(ageNames.slice().reverse())
.enter().append("g")
.attr("class", "legend")
.attr("transform", function (d, i) {
return "translate(0," + i * 20 + ")";
});
legend.append("rect")
.attr("x", width - 10)
.attr("width", 15)
.attr("height", 15)
.style("fill", color);
legend.append("text")
.attr("x", width - 14)
.attr("y", 9)
.attr("dy", ".35em")
.style("text-anchor", "end")
.text(function (d) { return d; });
svg.append("text")
.text("Project Artifacts By PAG")
.attr("x", width / 2)
.attr("y", 0 - (margin.top / 2))
.attr("text-anchor", "middle")
.style("text-decoration", "underline")
.attr("class", "title");
}
Tito
Apr 20, 2016, 8:05:05 PM4/20/16
to d3-js
On Tuesday, April 19, 2016 at 11:01:08 AM UTC-7, VJAY AROCKIASAMY wrote:
VJAY AROCKIASAMY
Apr 25, 2016, 2:02:24 PM4/25/16
to d3-js
Tito,
Thanks for your time and working sample.
Appreciate your help.
On Tuesday, April 19, 2016 at 2:01:08 PM UTC-4, VJAY AROCKIASAMY wrote:
Reply all
Reply to author
Forward
0 new messages