d3js Focus+Context via Brushing chart tooltip.
89 views
Skip to first unread message

Ashan Dhananjaya
Jul 31, 2015, 10:30:32 AM7/31/15
to d3-js
Hi all,

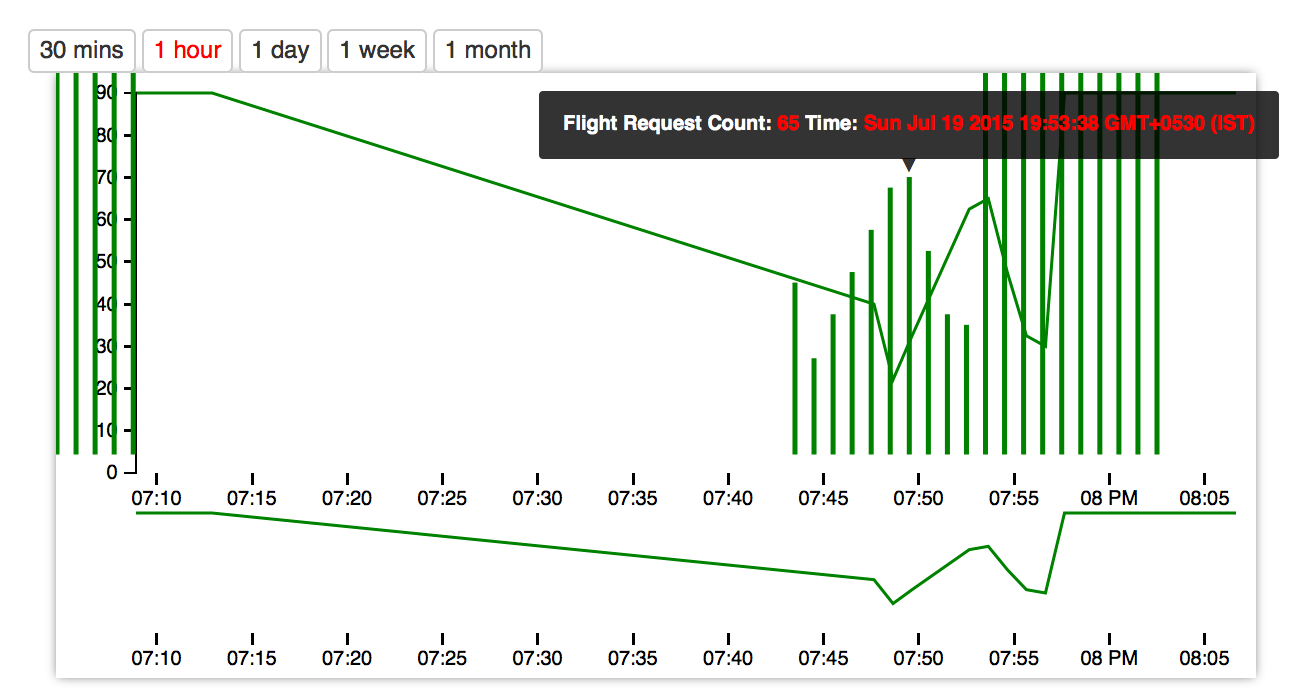
Now i need to add a tooltip to it.So i tried the example chart "Using d3-tip to add tooltips to a d3 bar chart" to get an idea. But as u can see in the chart i made,the tool tip does not place correctly. It doesn't move/sticked with the line and i still could not find the issue. Im attaching my code here,
var margin = {top: 10, right: 10, bottom: 100, left: 40},
        margin2 = {top: 220, right: 10, bottom: 20, left: 40},
        width = 600 - margin.left - margin.right,
        height = 300 - margin.top - margin.bottom,
        height2 = 300 - margin2.top - margin2.bottom;

        var parseDate = d3.time.format("%b %Y").parse;

        var x = d3.time.scale().range([0, width]),
        x2 = d3.time.scale().range([0, width]),
        y = d3.scale.linear().range([height, 0]),
        y2 = d3.scale.linear().range([height2, 0]);

        var xAxis = d3.svg.axis().scale(x).orient("bottom"),
        xAxis2 = d3.svg.axis().scale(x2).orient("bottom"),
        yAxis = d3.svg.axis().scale(y).orient("left");

        var brush = d3.svg.brush()
        .x(x2)
        .on("brush", brushed);

        var line = d3.svg.line()
        .interpolate("linear")
        .x(function(d) { return x(d.timeStamp); })
        .y(function(d) { return y(d.inFlightRequestCount); });

        var tip = d3.tip()
        .attr('class', 'd3-tip')
        .offset([-10, 0])
        .html(function(d) {
            return "<strong>Flight Request Count:</strong> <span style='color:red'>" + d.inFlightRequestCount +
            "</span> <strong>Time:</strong> <span style='color:red'>" + new Date(d.timeStamp) + "</span>";
        })

        var line2 = d3.svg.line()
        .interpolate("linear")
        .x(function(d) { return x2(d.timeStamp); })
        .y(function(d) { return y2(d.inFlightRequestCount); });

        var svg = d3.select("#rowTable1").append("svg")
        .attr("width", width + margin.left + margin.right)
        .attr("height", height + margin.top + margin.bottom);

        svg.append("defs").append("clipPath")
        .attr("id", "clip")
        .append("rect")
        .attr("width", width)
        .attr("height", height);

        var focus = svg.append("g")
        .attr("class", "focus")
        .attr("transform", "translate(" + margin.left + "," + margin.top + ")");

        var context = svg.append("g")
        .attr("class", "context")
        .attr("transform", "translate(" + margin2.left + "," + margin2.top + ")");


        svg.call(tip);

        var data = jsonDataFlightRequest;

        x.domain(d3.extent(data, function(d) { return d.timeStamp; }));
        y.domain([0, d3.max(data, function(d) { return d.inFlightRequestCount; })]);


        x.domain(d3.extent(data, function(d) { return d.timeStamp; }));
        y.domain([0, d3.max(data, function(d) { return d.inFlightRequestCount; })]);
        x2.domain(x.domain());
        y2.domain(y.domain());

        focus.append("path")
        .datum(data)
        .attr("class", "line")
        .attr("d", line);

        focus.append("g")
        .attr("class", "x axis")
        .attr("transform", "translate(0," + height + ")")
        .call(xAxis);

        focus.append("g")
        .attr("class", "y axis")
        .call(yAxis);

        context.append("path")
        .datum(data)
        .attr("class", "line")
        .attr("d", line2);

        context.append("g")
        .attr("class", "x axis")
        .attr("transform", "translate(0," + height2 + ")")
        .call(xAxis2);

        context.append("g")
        .attr("class", "x brush")
        .call(brush)
        .selectAll("rect")
        .attr("y", -6)
        .attr("height", height2 + 7);

        svg.selectAll(".line2")
        .data(data)
        .enter().append("rect")
        .attr("class", "line")
        .attr("x", function(d) { return x(d.timeStamp); })
        .attr("width", 1)
        .attr("y", function(d) { return y(d.inFlightRequestCount); })
        .attr("height", function(d) { return height - y(d.inFlightRequestCount); })
        .on('mouseover', tip.show)
        .on('mouseout', tip.hide)


        function brushed() {
          x.domain(brush.empty() ? x2.domain() : brush.extent());
          focus.select(".line").attr("d", line);
          focus.select(".x.axis").call(xAxis);
      }

      function type(d) {
          d.date = parseDate(d.timeStamp);
          d.price = +d.inFlightRequestCount;
          return d;
      }
Can anyone please help me to overcome this problem.Any help will be really appreciated.
Thank You!
Best Regards,
Ashan
Reply all
Reply to author
Forward
0 new messages