Display more attributes per node/edge
39 views
Skip to first unread message
Dario P Colombotto
Sep 21, 2016, 3:27:24 AM9/21/16
to cytoscape...@googlegroups.com
Hi all,
I saw that Cytoscape offers a lot of advanced graphic features for displaying nodes (chart, images, etc.), but how to display more than 1 node attribute (maybe in a new line) ? If not possible, someone knows if an App exists for this purpose? (same for edges)
For example, each node could represent a person and I would display "Name", "Age" and "Weight" (possibly in different lines or positions)...
Thanks and best regards,
Dario
piet molenaar
Sep 22, 2016, 7:44:54 AM9/22/16
to cytoscape-helpdesk
Hi Dario,

Imho these attributes would be excellent for visualization as a visual property; e.g map Weight to nodesize and age to color as described here: http://manual.cytoscape.org/en/stable/Styles.html#styles-tutorials.
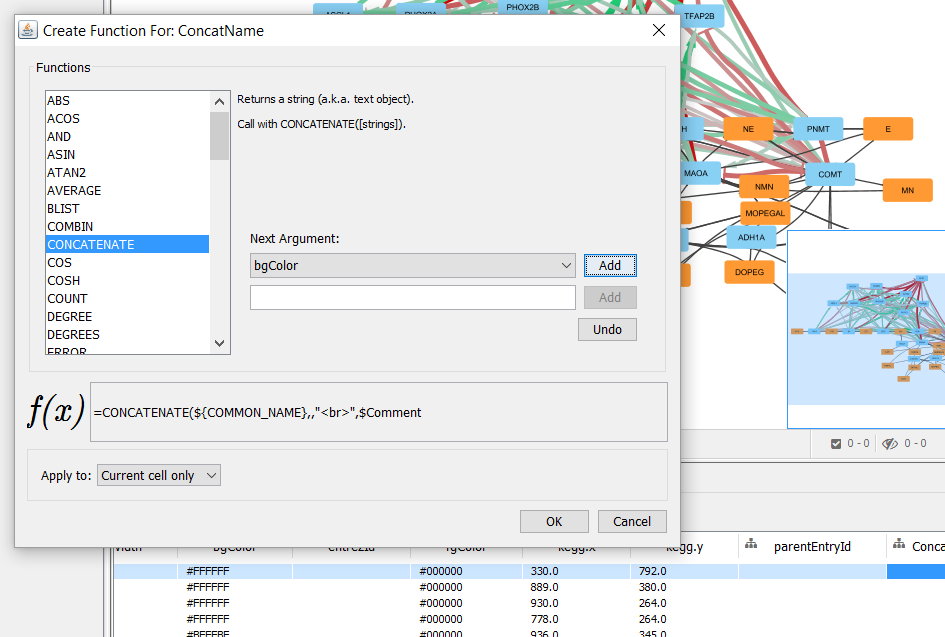
Otherwise you might want to create a new node String attribute that uses a function to concatenate the values of the other attributes, described here: http://manual.cytoscape.org/en/stable/Column_Data_Functions_and_Equations.html
Use that concatenated value as node label in your visual style
see also picture attached.
Hope this helps,
Piet

On Wed, Sep 21, 2016 at 9:27 AM, Dario P Colombotto <darioco...@gmail.com> wrote:
Hi all,I saw that Cytoscape offers a lot of advanced graphic features for displaying nodes (chart, images, etc.), but how to display more than 1 node attribute (maybe in a new line) ? If not possible, someone knows if an App exist for this purpose? (same for edges)For example, each node could represent a person and I would display "Name", "Age" and "Weight" (possibly in different lined or positions)...
Thanks and best regards,Dario
--
You received this message because you are subscribed to the Google Groups "cytoscape-helpdesk" group.
To unsubscribe from this group and stop receiving emails from it, send an email to cytoscape-helpdesk+unsub...@googlegroups.com.
To post to this group, send email to cytoscape-helpdesk@googlegroups.com.
Visit this group at https://groups.google.com/group/cytoscape-helpdesk.
For more options, visit https://groups.google.com/d/optout.
Piet Molenaar
piet...@gmail.com
Department of Oncogenomics, M1-131
Academic Medical Center
University of Amsterdam
Meibergdreef 9
1105 AZ Amsterdam
the Netherlands
tel (+31) 20-5666592
fax (+31) 20-6918626
piet...@gmail.com
Department of Oncogenomics, M1-131
Academic Medical Center
University of Amsterdam
Meibergdreef 9
1105 AZ Amsterdam
the Netherlands
tel (+31) 20-5666592
fax (+31) 20-6918626
Dario P Colombotto
Sep 24, 2016, 2:59:55 PM9/24/16
to cytoscape...@googlegroups.com
Hi Piet, many thanks for your hint.
I already thought about fields concatenation, but this doesn't solve my problem since in that way values are in one line and I cannot control the new line; by inserting "\n" doesn't work.
Do you have any other suggestion or workaround or maybe an App that allows this?
I'm not a technician but a simple workaround could be to find a way to force new line using a special char sequence (e.g. \n), even if the best solution is to add multiple labels in different positions.
Thanks and best regards,
Unfortunately, label visualization is too "ugly" if I concatenate fields because for each node, it will make a new lines basing on the length of values without any formatting rule, e.g.:
Node 1
Name: Dario; Age:
15; Field2: 1234...
Node 2
Name: Edward Johnson
Marquez; Age: 33; Fie...
I'm not a technician but a simple workaround could be to find a way to force new line using a special char sequence (e.g. \n), even if the best solution is to add multiple labels in different positions.
Thanks and best regards,
Dario
On Thursday, September 22, 2016 at 1:44:54 PM UTC+2, Piet wrote:
Hi Dario,Imho these attributes would be excellent for visualization as a visual property; e.g map Weight to nodesize and age to color as described here: http://manual.cytoscape.org/en/stable/Styles.html#styles-tutorials.Otherwise you might want to create a new node String attribute that uses a function to concatenate the values of the other attributes, described here: http://manual.cytoscape.org/en/stable/Column_Data_Functions_and_Equations.htmlUse that concatenated value as node label in your visual stylesee also picture attached.Hope this helps,Piet
On Wed, Sep 21, 2016 at 9:27 AM, Dario P Colombotto <darioco...@gmail.com> wrote:
Hi all,I saw that Cytoscape offers a lot of advanced graphic features for displaying nodes (chart, images, etc.), but how to display more than 1 node attribute (maybe in a new line) ? If not possible, someone knows if an App exist for this purpose? (same for edges)For example, each node could represent a person and I would display "Name", "Age" and "Weight" (possibly in different lined or positions)...Thanks and best regards,Dario
--
You received this message because you are subscribed to the Google Groups "cytoscape-helpdesk" group.
To unsubscribe from this group and stop receiving emails from it, send an email to cytoscape-helpdesk+unsub...@googlegroups.com.
To post to this group, send email to cytoscape...@googlegroups.com.
Visit this group at https://groups.google.com/group/cytoscape-helpdesk.
For more options, visit https://groups.google.com/d/optout.
Reply all
Reply to author
Forward
0 new messages
