Visualization of Clusters
30 views
Skip to first unread message

ea00...@gmail.com
Jul 7, 2016, 1:56:01 PM7/7/16
to cytoscape-helpdesk
I was wondering if there is a tutorial on the visualization of clusters.
I used a different program to produce clusters of protein structures by k-means clustering of dihedral angles. When importing the clusters as nodes, how do I change the size of each node to represent the number of members it contains (weight by size). Also, I'd like to relate the nodes with edges from an RMSD matrix (also computed in an external program) - what is the best way to import the edge matrix?
Thanks

Matthias König
Jul 12, 2016, 3:07:29 AM7/12/16
to cytoscape-helpdesk
The trick is to create a custom visual style for your network.
Within the visual style you define how edge and node attributes map to certain visual attributes, like for instance node color, node size, or edge width, edge color.
So the first step is having a node or edge attribute with the data you want to map. In your example this is the number of members.
- import the number_of_members as a node attribute
- click on Style in the Control Panel on the Left and make sure the "Node" tab is selected (tabs are on the bottom)
- select "Lock node width and height"
- click on Size in Porperties
- click on Column and select your imported node attribute
- click on Mapping type and select continous mapping
- adapt the mapping
Analogue for the edge attribute (RMSD)
For the import of the edge matrix you need a suitable graph format.
http://wiki.cytoscape.org/Cytoscape_User_Manual/Network_Formats
The simplest is to write a csv from your adjacency matrix and an additional node attribute file for the cluster size.
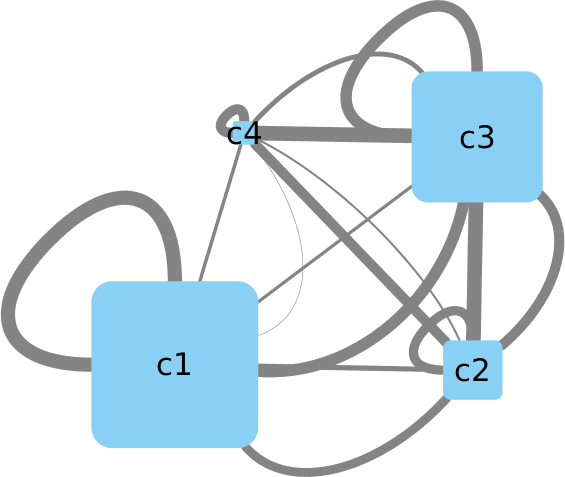
I attached an example how you could do this in python and an example visualization (with session file).
Matthias
Within the visual style you define how edge and node attributes map to certain visual attributes, like for instance node color, node size, or edge width, edge color.
So the first step is having a node or edge attribute with the data you want to map. In your example this is the number of members.
- import the number_of_members as a node attribute
- click on Style in the Control Panel on the Left and make sure the "Node" tab is selected (tabs are on the bottom)
- select "Lock node width and height"
- click on Size in Porperties
- click on Column and select your imported node attribute
- click on Mapping type and select continous mapping
- adapt the mapping
Analogue for the edge attribute (RMSD)
For the import of the edge matrix you need a suitable graph format.
http://wiki.cytoscape.org/Cytoscape_User_Manual/Network_Formats
The simplest is to write a csv from your adjacency matrix and an additional node attribute file for the cluster size.
I attached an example how you could do this in python and an example visualization (with session file).
"""
Export RMSD matrix with cluster size
"""

import numpy as np
np.random.seed(12345)
N = 4  # number of clusters

# 4 clusters with different numbers of members
cluster_id = ["c1", "c2", "c3", "c4"]
cluster_size = [5, 2, 4, 1]

# RMSD matrix (4 x 4) between all clusters (here just random for simplification)
RMSD = np.random.rand(N, N)

# write network file with edge attribute
with open("cluster-graph.csv", "w") as f:
    f.write("source,target,interaction,directed,RMSD\n")
    for k in xrange(N):
        for i in xrange(N):
            f.write("{},{},pp,TRUE,{}\n".format(cluster_id[k], cluster_id[i], RMSD[k,i]))


# write node attribute size
with open("cluster-size.csv", "w") as f:
    f.write("cluster,size\n")
    for k in xrange(N):
        f.write("{},{}\n".format(cluster_id[k], cluster_size[k]))
Matthias
ea00...@gmail.com
Jul 12, 2016, 2:38:18 PM7/12/16
to cytoscape-helpdesk
This is so kind of you - thanks for being tremendously helpful!
Reply all
Reply to author
Forward
0 new messages