ClueGO enrichment analysis and color-coded cluster contribution: please help/direct
37 views
Skip to first unread message

KimS
Jun 29, 2017, 8:06:49 PM6/29/17
to cytoscape-helpdesk
Dear all,
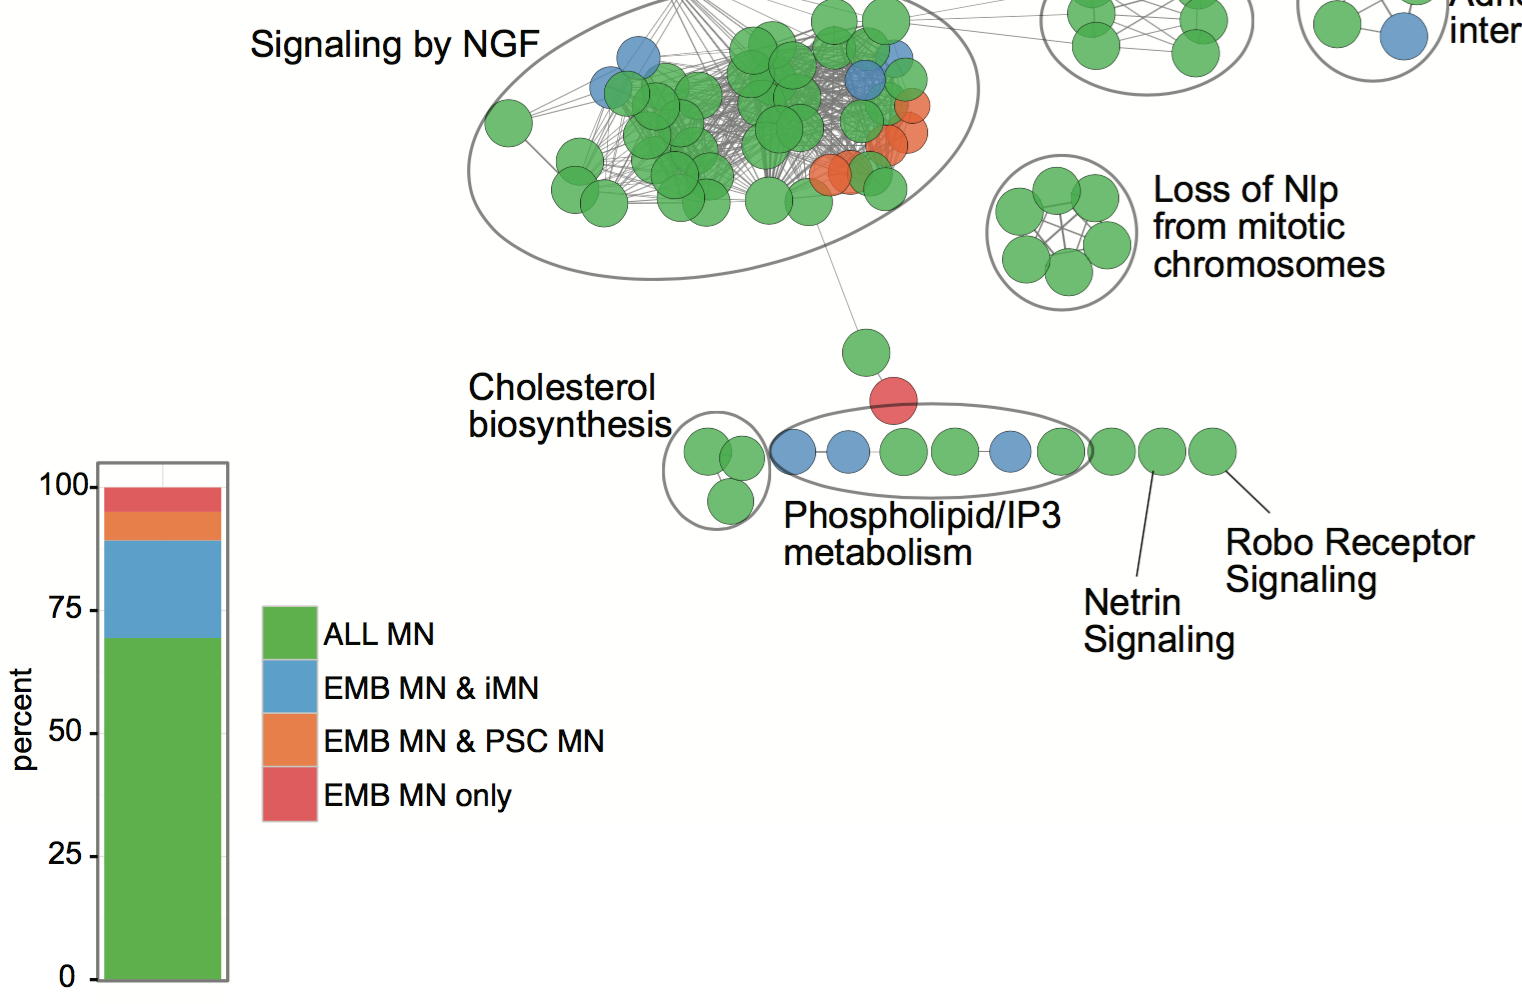
To understand the contribution of 4 clusters in reactome pathway enrichment, I am trying to recreate a former analysis/figure with new data. I am a newbie to Cytoscape and ClueGO, and have sought through manuals and online fora looking for assistance.
Each cluster contains a gene list of approx. 2-3k genes. Ideally, I would like to have the nodes color-coded per main contribution of the node, or relative to the contribution of each node.
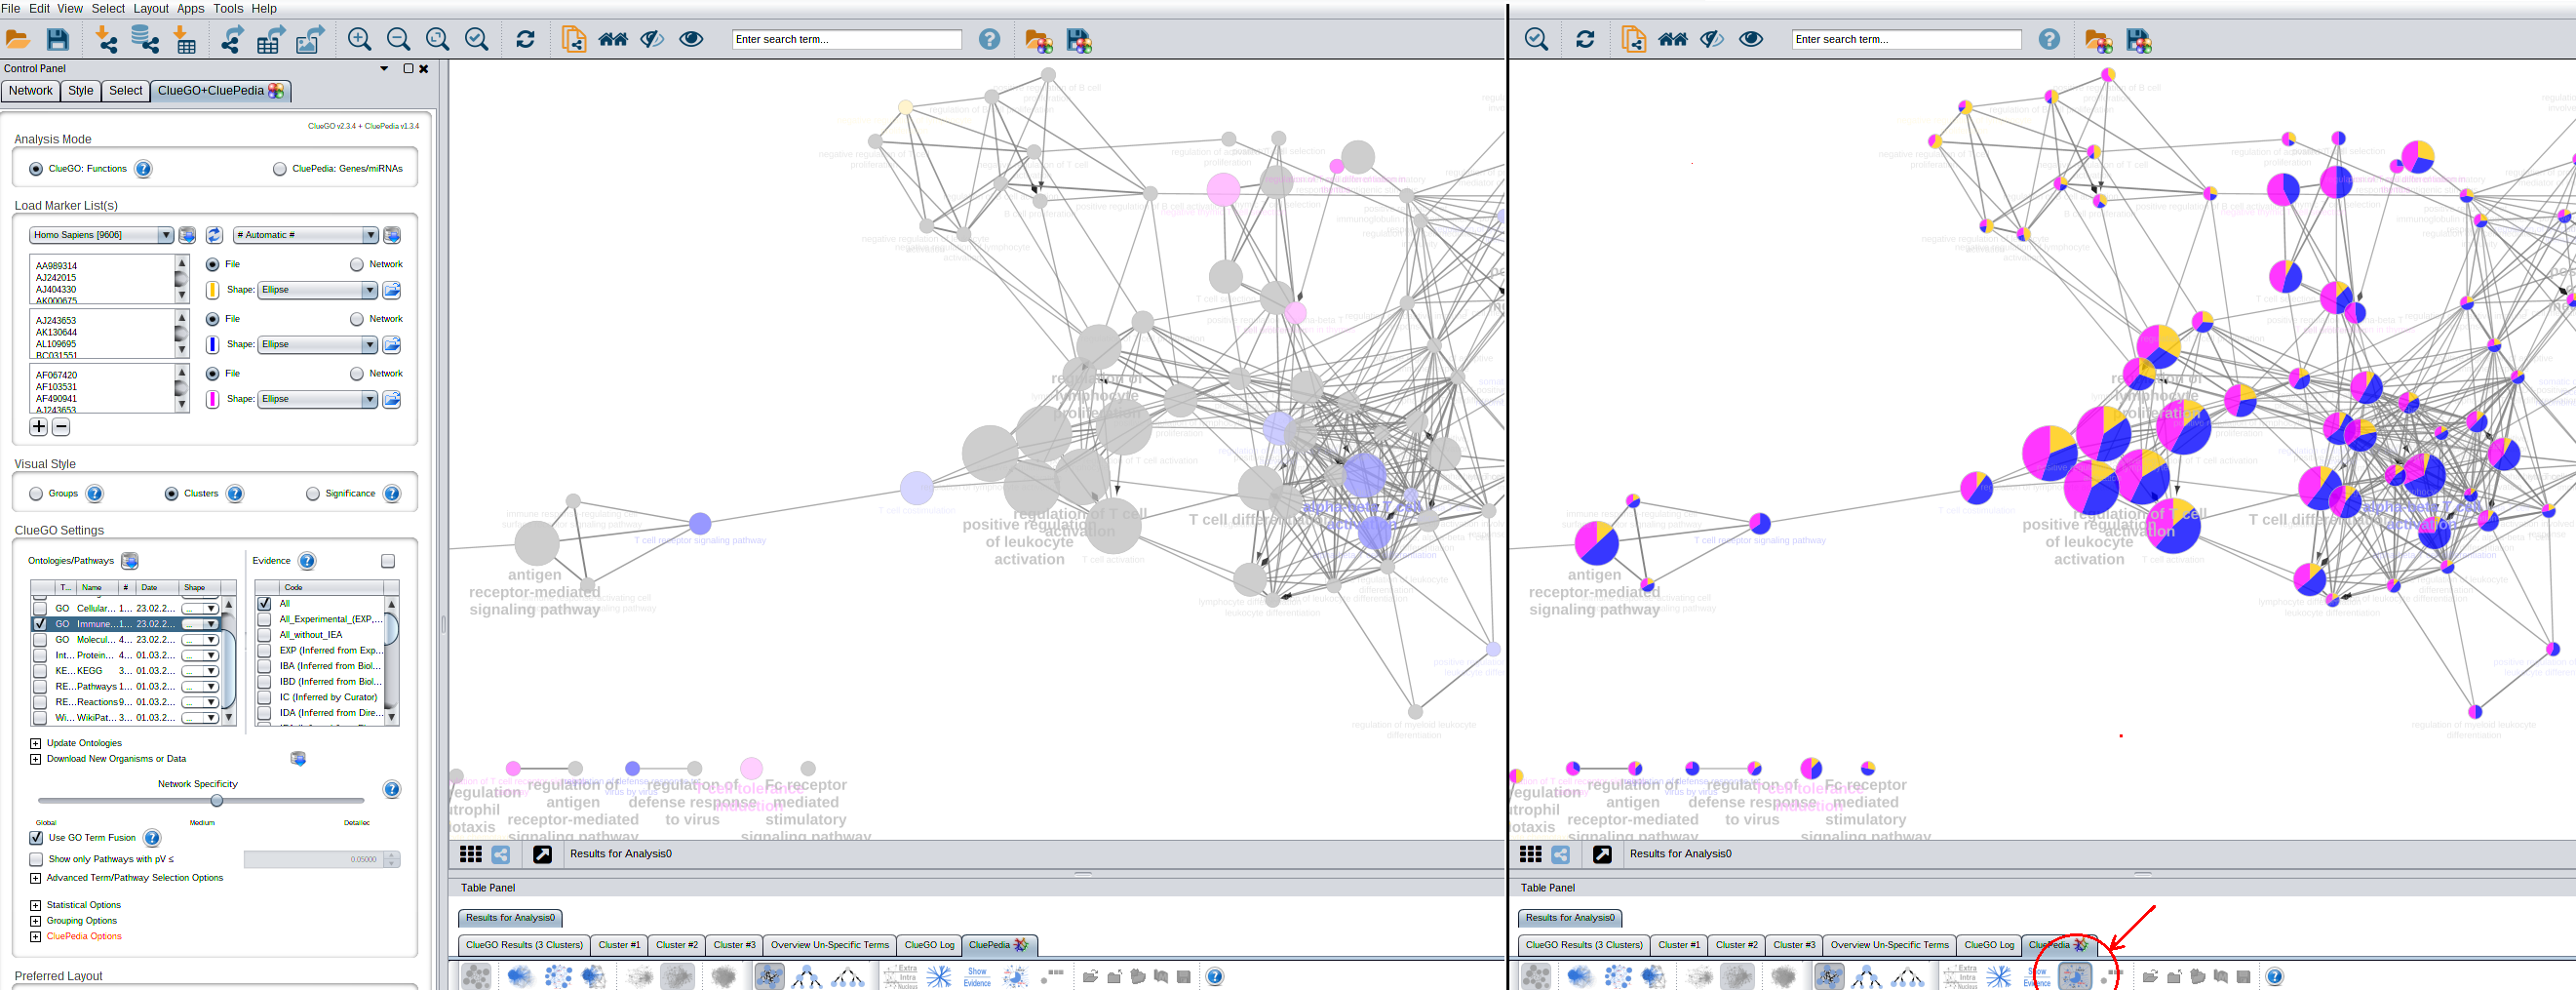
Any assistance that can help me get closer to the former analysis/layout (attached) from where I am currently (attached), is very very much appreciated! Feel free to refer me elsewhere if I have missed an explanation or the answer elsewhere on the web. Also, please let me know if more information is needed to assist.
Thank you kindly in advance,
KIm

Bernhard
Jul 4, 2017, 6:04:41 AM7/4/17
to cytoscape-helpdesk
Hi KimS,
2-3k genes is quite a lot so the biggest cluster list will probably take over the coloring of the nodes. If possible try to have equal sized lists or be a bit more restrictive with the larger lists like more genes/node or a higher percentage mapped. But anyway you can use the percentage visualization with CluePedia. See below:
Best
Reply all
Reply to author
Forward
0 new messages