overlaying gene expression values in existing ClueGo output

BIOMICS

Alex Pico
The network generated by the ClueGo app consists of Gene Ontology term nodes, not gene nodes. So, you can't map gene expression values directly. If you figure out a way to reduce or summarize your data in terms of GO terms, then you could map those values. The ClueGo node table includes a list of genes per GO term, for example. Taking the mean or median, however, is probably not a good idea... You could perhaps categorize your genes into up/down sets and then display percentage up/down in a pie chart. That's just one idea. Regardless, those are steps you'd have to decide upon and prepare outside of Cytoscape first.
Hope this helps,
- Alex

Bernhard
gene vs Experiments:
e.g.
NAME EXP1 EXP2 EXP3 EXP4 etc...
Gene1 3.4 4.5 6.7 2.3
Gene2 1.4 6.3 2.5 0.4
etc...
and a tab delimited file defining groups if you wish like (optional):
e.g.
GROUPS Condition1 Condition2 etc...
EXP1 YES NO
EXP2 YES NO
EXP3 NO YES
EXP4 NO YES
etc...
Make sure the names in the data file match the group file e.g. EXP1 ! It is case sensitive. Under groups you will be able then to select the defined groups e.g. Condition1.
Make also sure that the gene ids in the data file are recognized by ClueGO!
Follow the steps enumerated in red.
1. Open the data panel
2. Load data like mentioned above.
3. Load groups (optional but very practical. You can define your groups (e.g. clinical data) in excel)
4. Select one group (you will have more options if you use custom groups, otherwise its all data or each experiment/patient separate)
5. Click "Update" (You should see now the subgroups in the selection list)
6. Select individual subgroups (use CTRL (on the keyboard) and Mouse to select)
7. Click "Import" to load the refined data groups.
(You can filter the data before you go on, like log transformation or filter out data points that are below or above a certain threshold.)
8. Here you can select if the data is shown as heatmap (linear) or as circular node with coloured sectors.
9. You can normalize data here (z-score) and set the max threshold to set to max color. If you select "mean" then the average over a selected group will be calculated.
10. Select here if you want to map data to all gene nodes on the network or only to selected ones.
11. Click "Update" to apply the mapping.
12. Here you can toggle the visualization (show/hide) the heatmaps on the gene nodes.
I hope it is clear. If not, let us know where you are blocked/
Best
BIOMICS
Hi Bernhard,
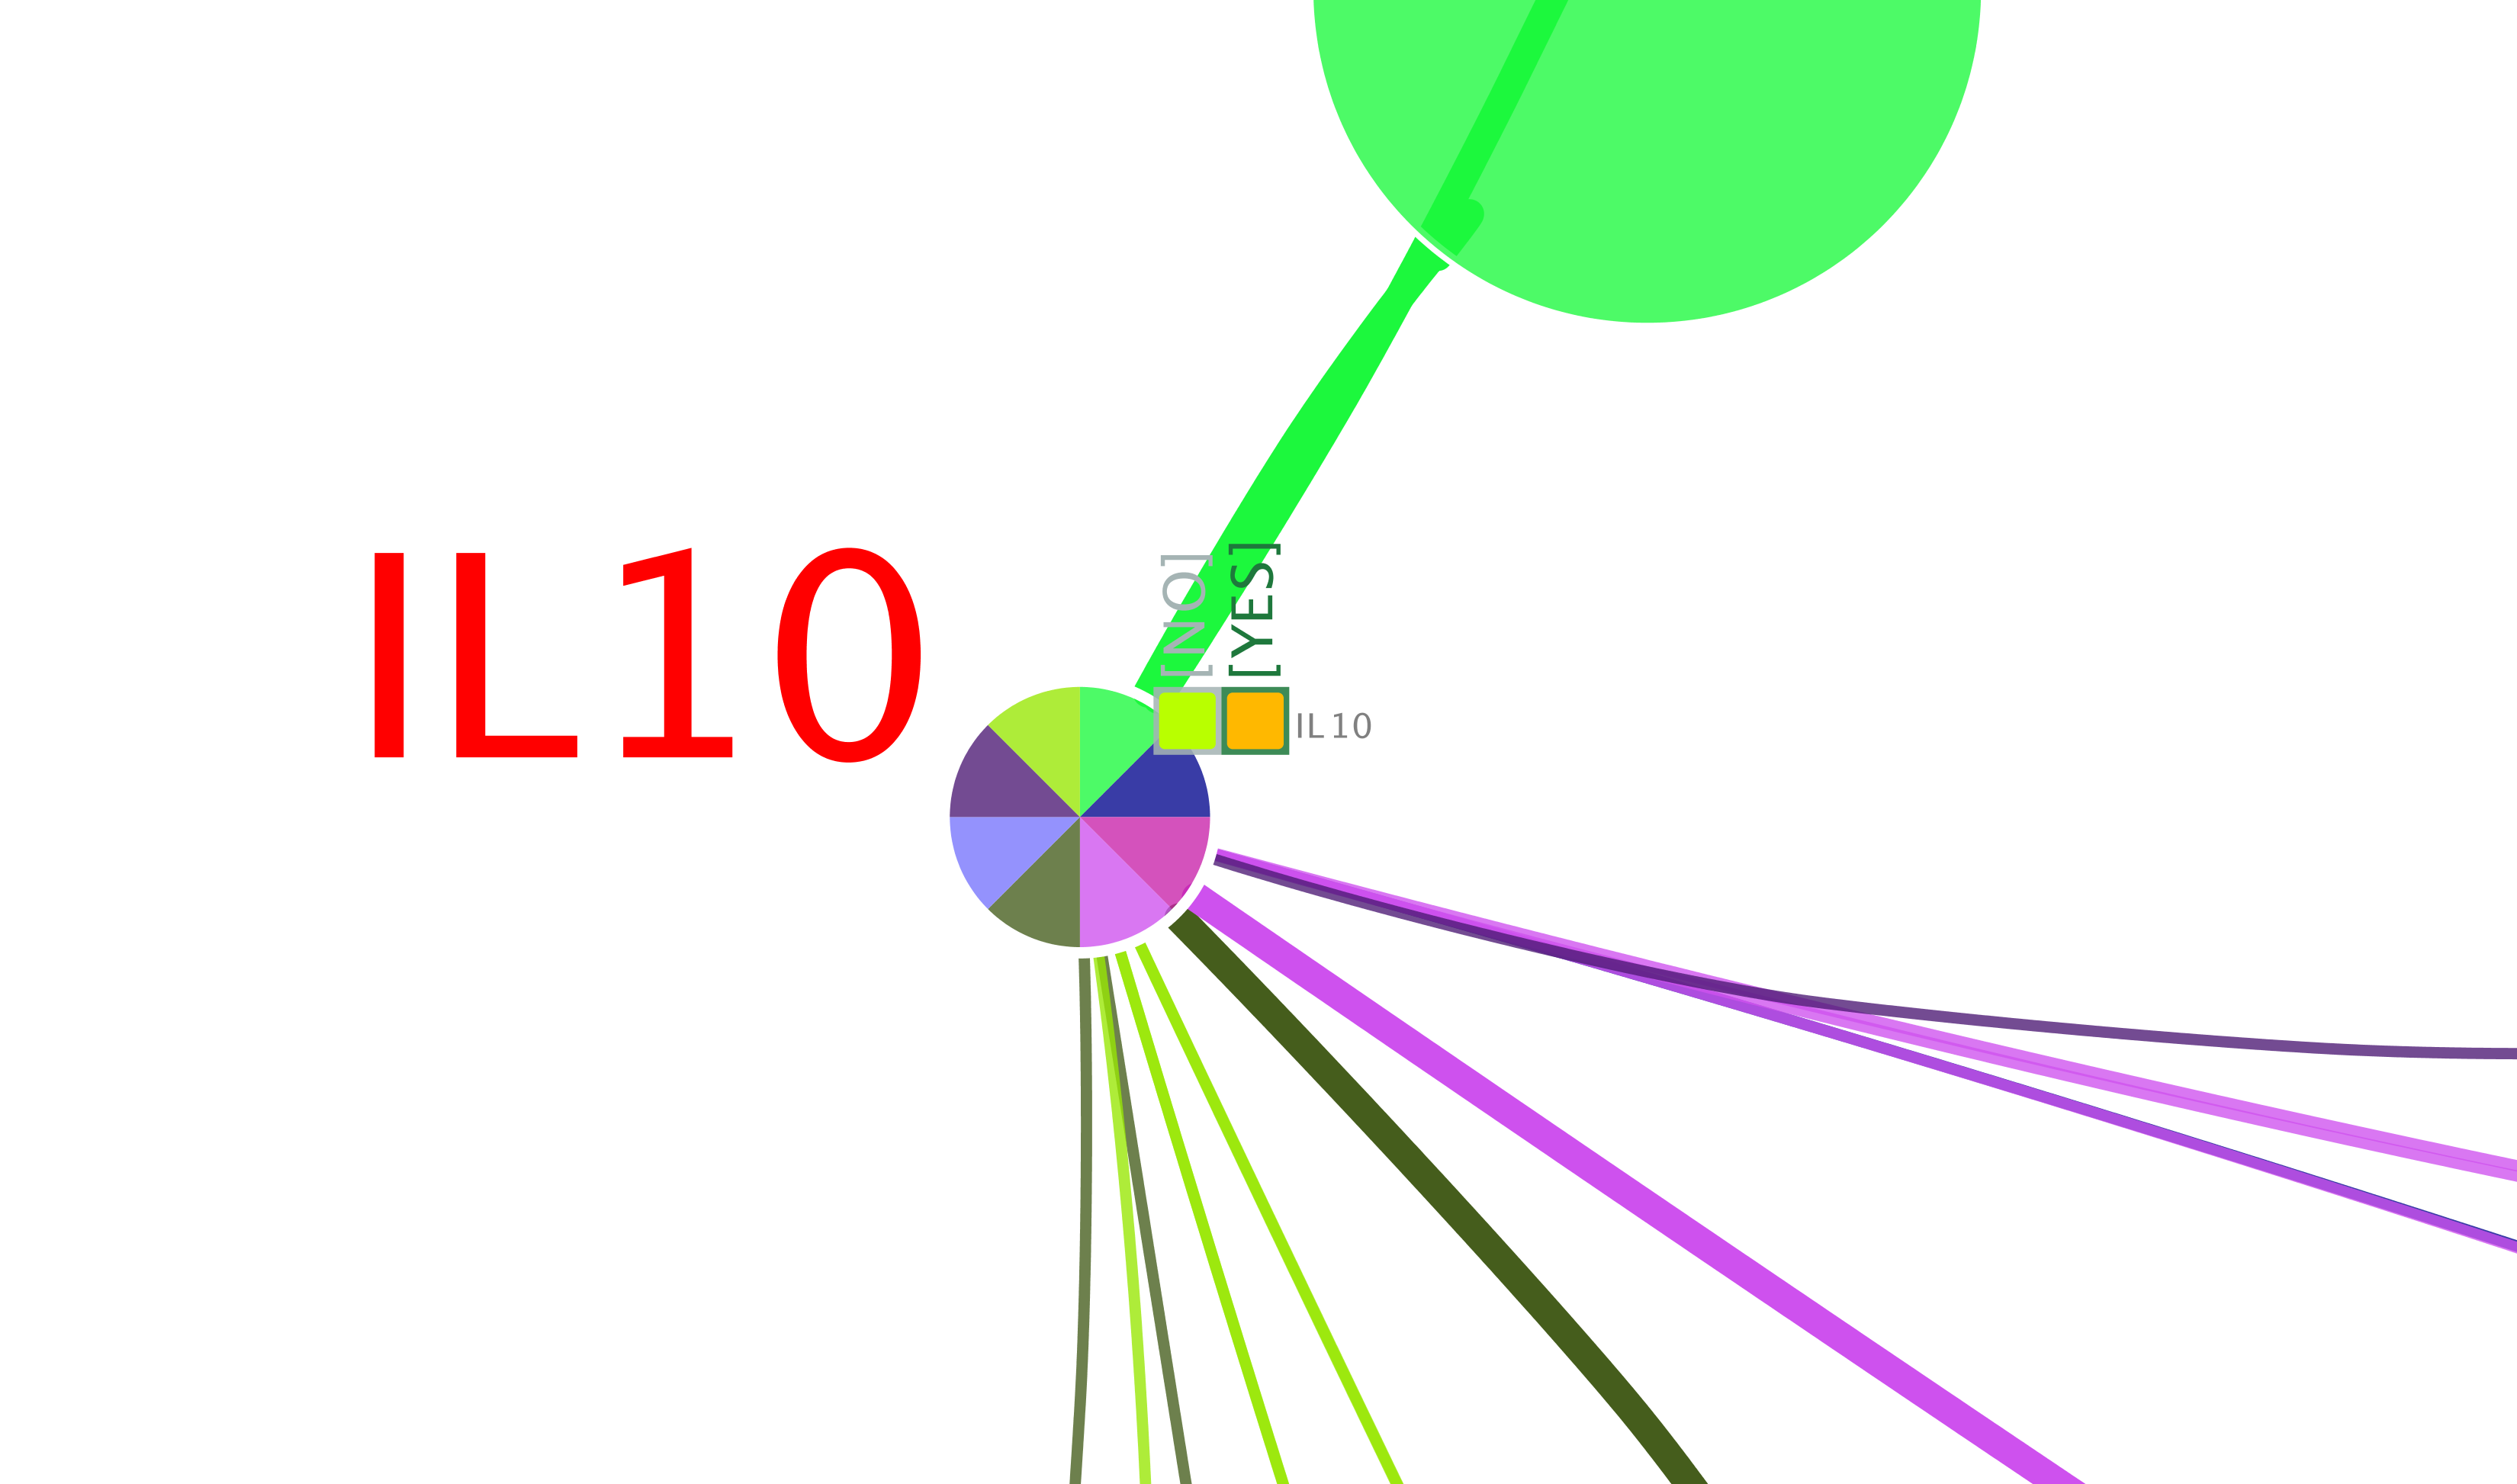
Thank you, it was very helpful and I was able to create a figure with the expression charts (please see attached trial sample figure). I’m currently working on how it could include more information. I wish to request few clarifications.
1) The image size is relatively very small so it defeats the purpose of putting the expression chart next to the nodes. I tried various ways to increase the size from the Styles option. However it only worked on the size of the nodes but not on the image itself. Please advice how I could increase the size of the image (expression chart) similar to the size of the node.
2) The default custom list of txt files in the CluePedia is not working since nearly all the txt files has missing column values. It would be kind enough if you could share the txt files you have used to create the expression images, which you described in your previous email.
3) While searching the Cytoscape App store I was able to find this App “Enhanced Graphics”. This App looks great, I installed the App but in the pull down menu of Cytoscape I could not see the App but it is there when I checked in the list of installed Apps. I’m using the latest version of Cytoscape 3.5.1. Please let me know if this App is compatible with the latest version of Cytoscape and how it could be made available in the pull down menu in the App list.
Many thanks,
Nara
Alex Pico
http://apps.cytoscape.org/apps/enhancedgraphics
--
You received this message because you are subscribed to the Google Groups "cytoscape-helpdesk" group.
To unsubscribe from this group and stop receiving emails from it, send an email to cytoscape-helpdesk+unsub...@googlegroups.com.
To post to this group, send email to cytoscape-helpdesk@googlegroups.com.
Visit this group at https://groups.google.com/group/cytoscape-helpdesk.
To view this discussion on the web visit https://groups.google.com/d/msgid/cytoscape-helpdesk/97d6f5ca-5367-442f-8c8e-2fb8b4a398b8%40googlegroups.com.
BIOMICS
To post to this group, send email to cytoscape...@googlegroups.com.
Visit this group at https://groups.google.com/group/cytoscape-helpdesk.
