100x lower performance for 3 node multi-master galera
641 views
Skip to first unread message

yahim stnsc
Oct 2, 2017, 1:44:45 PM10/2/17
to codership
Hi all,
Once i switched our application to use galera multi-master on 3 nodes i started to have performance issued.
I started benchmarking the DB engines with sysbench and it seems to confirm what i experience in the app.
With standalone mariadb the perf is about 35000 inserts/transactions/sec
With galera enabled the perf is 350 inserts/transactions/pers.
I initially placed the question here so you can read more details on stackexchange: https://dba.stackexchange.com/questions/187458/100x-less-insert-performance-with-galera-multi-master
I am out of ideas to try.
Is the binlog required for fast replication? GTIDs?
Regards,
Mihai

James Wang
Oct 3, 2017, 4:40:37 AM10/3/17
to codership
How many CPUs you have?
Galera does not use binlog for replication
noticed that your innodb_buffer_pool_size = 300MB - what is your total RAM?
What is your log file size?
Galera does not use binlog for replication
There will be performance hit but not that much. My experience is about 30%
yahim stnsc
Oct 3, 2017, 9:22:16 AM10/3/17
to codership
Hi
Bin-log is not enabled.
I have 8 core CPU's and 12 GB RAM.
Writes are going to only one master.
I tested also with innodb_log_file_size = 500000000 but its the same
What doubles performance (50x hit) is to change flush_method to O_DSYNC.
On the salve i see that even thought i have multiple threads, most of them are just sleeping and only one is actually committing so practically somehow the master is not making things in parallel.
From what i read galera must ensure global ordering but from what i understand this is just to establish the order right?
repl.commit_order = 3 which is the default (http://galeracluster.com/documentation-webpages/galeraparameters.html#repl-commit-order)
Setting repl.commit_order to 2 made my cluster unusable. It did not start anymore.
+----+-------------+-----------+---------+---------+------+--------------------+------------------+----------+
| Id | User | Host | db | Command | Time | State | Info | Progress |
+----+-------------+-----------+---------+---------+------+--------------------+------------------+----------+
| 1 | system user | | NULL | Sleep | 535 | wsrep aborter idle | NULL | 0.000 |
| 2 | system user | | NULL | Sleep | 0 | committed 403823 | NULL | 0.000 |
| 3 | system user | | NULL | Sleep | 0 | committed 403833 | NULL | 0.000 |
| 4 | system user | | NULL | Sleep | 0 | committed 403830 | NULL | 0.000 |
| 5 | system user | | NULL | Sleep | 0 | committed 403824 | NULL | 0.000 |
| 6 | system user | | NULL | Sleep | 0 | committed 403834 | NULL | 0.000 |
| 7 | system user | | NULL | Sleep | 0 | committed 403831 | NULL | 0.000 |
| 8 | system user | | NULL | Sleep | 0 | committed 403822 | NULL | 0.000 |
| 9 | system user | | NULL | Sleep | 0 | committed 403825 | NULL | 0.000 |
| 10 | system user | | NULL | Sleep | 0 | committed 403828 | NULL | 0.000 |
| 11 | system user | | NULL | Sleep | 0 | committed 403835 | NULL | 0.000 |
| 12 | system user | | NULL | Sleep | 0 | committing 403836 | NULL | 0.000 |
| 13 | system user | | NULL | Sleep | 0 | committed 403832 | NULL | 0.000 |
| 14 | system user | | NULL | Sleep | 0 | committed 403821 | NULL | 0.000 |
| 15 | system user | | NULL | Sleep | 0 | committed 403827 | NULL | 0.000 |
| 16 | system user | | NULL | Sleep | 0 | committed 403826 | NULL | 0.000 |
| 17 | system user | | NULL | Sleep | 0 | committed 403829 | NULL | 0.000 |
James Wang
Oct 3, 2017, 12:07:20 PM10/3/17
to codership
Increase innodb buff pool to about 8GB
Do all your three nodes have the same hardware specification the standalone one? Any RAID?
what is your wsrep_cert_deps_distance?
Do all your three nodes have the same hardware specification the standalone one? Any RAID?
Check your nodes io status
3 nodes have to identical settings and hardware
yahim stnsc
Oct 4, 2017, 4:05:34 AM10/4/17
to codership
Do all your three nodes have the same hardware specification the standalone one? Any RAID?
Nodes have same hw spec. 8 cores, 12 GB ram. No RAID. SSD Enterprise level, tested with fio at random writes can do aprox 30K IOPS.
Nodes have identical configuration as i deploy with ansible scripts which make no difference and i checked them also.
Here are the operational values of last run..
| innodb_buffer_pool_size | 6291456000 |
At this point the two node multi-master cluster was doing 600 TPS.
| wsrep_apply_oooe | 0.991822 |
| wsrep_apply_oool | 0.000000 |
| wsrep_apply_window | 50.221744 |
| wsrep_causal_reads | 0 |
| wsrep_cert_deps_distance | 196.591468 |
| wsrep_cert_index_size | 228 |
| wsrep_cert_interval | 62.326873 |
| wsrep_cluster_conf_id | 2 |
| wsrep_cluster_size | 2 |
| wsrep_commit_oooe | 0.000000 |
| wsrep_commit_oool | 0.000000 |
| wsrep_commit_window | 49.228722
| wsrep_flow_control_paused | 0.000489 |
| wsrep_flow_control_paused_ns | 26905407448 |
| wsrep_flow_control_recv | 1137 |
| wsrep_flow_control_sent | 0
| wsrep_last_committed | 51647 |
| wsrep_local_bf_aborts | 0 |
| wsrep_local_cached_downto | 9340 |
| wsrep_local_cert_failures | 0 |
| wsrep_local_commits | 42200 |
| wsrep_local_index | 0 |
| wsrep_local_recv_queue | 0 |
| wsrep_local_recv_queue_avg | 0.001572 |
| wsrep_local_recv_queue_max | 2 |
| wsrep_local_recv_queue_min | 0 |
| wsrep_local_replays | 0 |
| wsrep_local_send_queue | 61 |
| wsrep_local_send_queue_avg | 13.045024 |
| wsrep_local_send_queue_max | 65 |
| wsrep_local_send_queue_min | 0 |
If i shutdown one node, so just one wsrep node, the performance seems still bad. Somehow it seems that the master does not execute more transactions in parallel and they get serialized.
James Wang
Oct 4, 2017, 4:31:01 AM10/4/17
to codership
Are all your nodes in the same DC?
Please post sar report here.
I am running out of ideas as well now. There is no much settings to play around - most of them can be left as default. Performance should not be so much hit. Try PXC 5.6 and see if there is any difference.
Please post sar report here.
Your cluster paused (Flow Control) 26 seconds - how long has the cluster been up?
I am running out of ideas as well now. There is no much settings to play around - most of them can be left as default. Performance should not be so much hit. Try PXC 5.6 and see if there is any difference.
yahim stnsc
Oct 4, 2017, 4:50:33 AM10/4/17
to codership
I monitored the IOPS when running the tests.
When running standalone for 40000 TPS i get about 1500 IOPS.
The weird part is that with galera cluster for 500 TPS the disk usage is also 1500 IOPS. Just wondering why so high?
Maybe is some cap on IOPS also testing it with FIO shows much more however i wonder why the Galera uses so much disk iops? Could it it be the innodb group commit is somehow not working as expected?
sar report while running the load in cluster
10:45:49 AM CPU %user %nice %system %iowait %steal %idle
10:45:50 AM all 1.64 0.00 1.89 3.53 0.00 92.94
10:45:51 AM all 1.51 0.00 1.51 2.77 0.00 94.21
10:45:52 AM all 1.64 0.00 2.01 3.90 0.00 92.45
10:45:53 AM all 1.51 0.00 1.76 3.77 0.00 92.96
10:45:54 AM all 1.64 0.00 1.77 3.41 0.00 93.18
10:45:55 AM all 1.39 0.00 1.64 3.53 0.00 93.44
10:45:56 AM all 1.14 0.00 1.64 3.03 0.00 94.18
10:45:57 AM all 1.39 0.00 1.64 3.78 0.00 93.19
10:45:58 AM all 1.88 0.00 2.13 3.51 0.00 92.48
10:45:59 AM all 1.51 0.00 1.51 2.90 0.00 94.07
Average: all 1.52 0.00 1.75 3.41 0.00 93.31
Mihai Stanescu
Oct 4, 2017, 4:53:55 AM10/4/17
to codership
Are all your nodes in the same DC?
Why do you mean by same DC?
--
You received this message because you are subscribed to a topic in the Google Groups "codership" group.
To unsubscribe from this topic, visit https://groups.google.com/d/topic/codership-team/DUKaYNeFmIs/unsubscribe.
To unsubscribe from this group and all its topics, send an email to codership-team+unsubscribe@googlegroups.com.
For more options, visit https://groups.google.com/d/optout.
James Wang
Oct 4, 2017, 4:57:29 AM10/4/17
to codership
Do: sar -A -f /var/log/sa/sa**
/var/log/sa/sa** is the file when you did you load test (massive insert)
All nodes in the same DC? How long is the cluster up and running? Try PXC 5.6 and see any difference.
All nodes in the same DC? How long is the cluster up and running? Try PXC 5.6 and see any difference.
Please also provide:
wsrep_provider_options
wsrep_cluster_address
Mihai Stanescu
Oct 4, 2017, 8:56:47 AM10/4/17
to James Wang, codership
Sorry i did not collect the sar thing but i will.
One thing to mention is that if i stop all nodes except one. The performance is still very bad (though increased a bit)
All nodes in same DC.
Cluster was running over the night
Variable_name: wsrep_provider_options
Value: base_dir = /var/lib/mysql/; base_host = 10.110.8.207; base_port = 4567; cert.log_conflicts = no; debug = no; evs.auto_evict = 0; evs.causal_keepalive_period = PT1S; evs.debug_log_mask = 0x1; evs.delay_margin = PT1S; evs.delayed_keep_period = PT30S; evs.inactive_check_period = PT0.5S; evs.inactive_timeout = PT15S; evs.info_log_mask = 0; evs.install_timeout = PT7.5S; evs.join_retrans_period = PT1S; evs.keepalive_period = PT1S; evs.max_install_timeouts = 3; evs.send_window = 4; evs.stats_report_period = PT1M; evs.suspect_timeout = PT5S; evs.use_aggregate = true; evs.user_send_window = 2; evs.version = 0; evs.view_forget_timeout = P1D; gcache.dir = /var/lib/mysql/; gcache.keep_pages_size = 0; gcache.mem_size = 0; gcache.name = /var/lib/mysql//galera.cache; gcache.page_size = 128M; gcache.recover = no; gcache.size = 128M; gcomm.thread_prio = ; gcs.fc_debug = 0; gcs.fc_factor = 1.0; gcs.fc_limit = 16; gcs.fc_master_slave = no; gcs.max_packet_size = 64500; gcs.max_throttle = 0.25; gcs.recv_q_hard_limit = 9223372036854775807; gcs.recv_q_soft_limit = 0.25; gcs.sync_donor = no; gmcast.listen_addr = tcp://0.0.0.0:4567; gmcast.mcast_addr = ; gmcast.mcast_ttl = 1; gmcast.peer_timeout = PT3S; gmcast.segment = 0; gmcast.time_wait = PT5S; gmcast.version = 0; ist.recv_addr = 10.110.8.207; pc.announce_timeout = PT3S; pc.checksum = false; pc.ignore_quorum = false; pc.ignore_sb = false; pc.linger = PT20S; pc.npvo = false; pc.recovery = true; pc.version = 0; pc.wait_prim = true; pc.wait_prim_timeout = PT30S; pc.weight = 1; protonet.backend = asio; protonet.version = 0; repl.causal_read_timeout = PT30S; repl.commit_order = 3; repl.key_format = FLAT8; repl.max_ws_size = 2147483647; repl.proto_max = 7; socket.checksum = 2; socket.recv_buf_size = 212992;
Variable_name: wsrep_cluster_address
Value: gcomm://10.110.8.207,10.110.8.208,10.110.8.209

Network/Systems Administrator
Oct 4, 2017, 9:06:57 AM10/4/17
to Mihai Stanescu, James Wang, codership
Hi,
may I suggest increasing your gcache.size & gcache.page_size
-Chris
--
You received this message because you are subscribed to the Google Groups "codership" group.
To unsubscribe from this group and stop receiving emails from it, send an email to codership-team+unsubscribe@googlegroups.com.
James Wang
Oct 4, 2017, 9:10:19 AM10/4/17
to codership
128M are not too small. I am not sure that would make much difference.
Suggestions:
1). Try to bootstrap start the node while other two stopped
2). Try PXC
Mihai Stanescu
Oct 4, 2017, 9:22:52 AM10/4/17
to James Wang, codership
I will try to put the galera cache file on a ramdisk. That is to check where this big amount of IOPS is coming from even though the throughput is bad.
I have rechecked the disk IOPS with fio and in a random write scenario with bs=4k, 4-8-16-24 writers and i get 62K IOPS. With bs=16k (which i think is innodb default) i get around 20k IOPS. So Innodb should have enough IOPS to eat.
Mihai Stanescu
Oct 4, 2017, 9:23:36 AM10/4/17
to James Wang, codership
i ran FIO with direct=1 and libaio method. Which should be close to what innodb is using.

Brian :
Oct 4, 2017, 2:57:30 PM10/4/17
to codership
Hi Mihai,
What kind of SSDs are they?
I think you will find same issue with non galera mariadb - did you try that?
>>> codership-tea...@googlegroups.com.
> --
> You received this message because you are subscribed to the Google Groups
> "codership" group.
What kind of SSDs are they?
I think you will find same issue with non galera mariadb - did you try that?
> --
> You received this message because you are subscribed to the Google Groups
> "codership" group.
> To unsubscribe from this group and stop receiving emails from it, send an
> email to codership-tea...@googlegroups.com.
Mihai Stanescu
Oct 5, 2017, 7:26:48 AM10/5/17
to Brian :, codership
Hi Brian
I installed Percona and it did not behave better but i did notice something.
By default they set innodb_flush_log_at_trx_commit=0
In my case it was =1.
So this flag =1 has a huge impact on performance if the galera plugin is loaded.
Its not so bad if there is no galera plugin (maybe because of innodb group commit?). Maybe loading galera plugin disables this.
Anyway i will leave this flag to 0 for now.
It is still a mistery why i could never get the DB to use 10000 IOPS but yeah. Maybe my FIO benchmarks were not accurate.
I will run with flush_log_at_trx_commit=0 for now.
Thank you all for the effort.
Regards
> You received this message because you are subscribed to the Google Groups
> "codership" group.
> To unsubscribe from this group and stop receiving emails from it, send an
> email to codership-team+unsubscribe@googlegroups.com.
You received this message because you are subscribed to a topic in the Google Groups "codership" group.
To unsubscribe from this topic, visit https://groups.google.com/d/topic/codership-team/DUKaYNeFmIs/unsubscribe.
To unsubscribe from this group and all its topics, send an email to codership-team+unsubscribe@googlegroups.com.
Mihai Stanescu
Oct 10, 2017, 3:33:46 AM10/10/17
to Brian :, codership
Hi all,
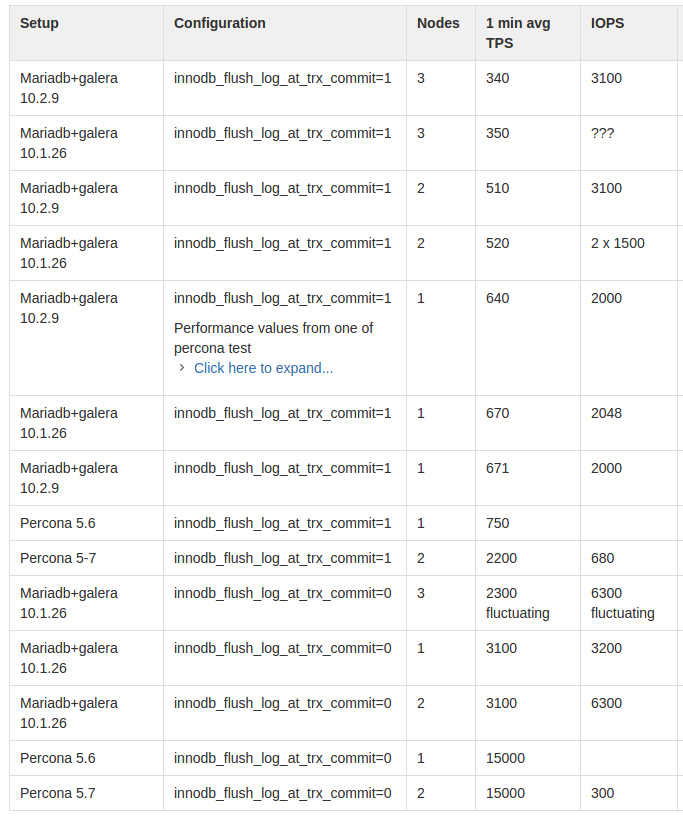
Just to give something back. Here's the results of the benchmarks i performed.
Unfortunatelly i could not make MariaDB work very fast with galera no matter what i tried. Event with relaxed flush log policy the amount of IOPS done is huge compared to PXC.

Bojan F
Mar 30, 2018, 3:09:50 AM3/30/18
to codership
I have also problem with Galera Cluster perfomances. Currently using version 10.2.6.
I noticed something similar as is desceribed here: https://jira.mariadb.org/browse/MDEV-14339
In short if I use log_bin parameter (on all 3 Galera Cluseter nodes) performances are 5-6 times better than without it despite I would expect worse results if system has to save also binary logs.
If I use log_bin only on 2 nodes but on 1 not then this node is bottleneck: wsrep_flow_control_sent start to increase, iostat -x statistics shows a lot of utilization, top shows bigger "wa" ... As I said above I don't see logic in that cause I would more expect this if I save binary logs.
But it looks that there is something behind that if log_bin is enabled performances are much better.
In some cases we use log_bin on first two Galera Cluster nodes so normally we have log_bin enabled on first two. But on 3rd not and so I started to investigate why is 3rd node so slower and shows above observations (iostat, wa, wsrep_flow_control ...)
I was doing very simple test. On first node I was inserting 20000 records, on other two I was checking what is going on with log_bin enabled on all 3 it takes 25s to do work, without it on all 3 it needs 140s.
I was playing also with other parameters but I didnt see any big changes. Of course innodb_flush_log_at_trx_commit must be 0 or 2 otherwise results can be even worse.
Any explanation why bin_log is important or if there is combination with some other parameter that we use?
My server.cnf settings:
[server]
port=3306
server-id=100
gtid-domain-id=100
gtid-strict-mode=OFF
log_bin=/tmp/binlog #!!!!!!
[mysqld]
[galera]
wsrep-restart-slave=1
wsrep_retry_autocommit=0
wsrep_on=ON
wsrep_provider=/usr/lib64/galera/libgalera_smm.so
wsrep_gtid_domain_id=100
wsrep_gtid_mode=ON
wsrep_sst_method=xtrabackup-v2
wsrep_node_incoming_address="192.168.172.137"
wsrep_sst_receive_address="192.168.172.137"
wsrep_node_address="192.168.172.137"
wsrep_node_name="node137"
wsrep_provider_options="evs.delay_margin=PT1S;evs.delayed_keep_period=PT10S;evs.auto_evict=0;evs.version=1"
wsrep_sst_auth=sst_user:mysqxyz
wsrep_notify_cmd=/opt/OpenEPC/bin/wsrep_notify.sh
wsrep_dirty_reads="1"
wsrep_cluster_name='galera_hss_100'
wsrep_cluster_address="gcomm://192.168.172.137,192.168.172.138,192.168.172.139"
my.cnf:
[mysqld]
skip-slave-start
skip-name-resolve
datadir=/var/lib/mysql
socket=/var/lib/mysql/mysql.sock
symbolic-links=0
binlog_format=ROW
default_storage_engine=InnoDB
innodb_autoinc_lock_mode=2
bind-address=0.0.0.0
transaction-isolation=READ-COMMITTED
query_cache_size=0
query_cache_type=0
innodb_log_file_size=256M
innodb_file_per_table
innodb_flush_log_at_trx_commit=2
Reply all
Reply to author
Forward
0 new messages