Zxing integration for Barcode Scanning
477 views
Skip to first unread message

ankit agarwal
May 8, 2012, 3:06:38 AM5/8/12
to codenameone...@googlegroups.com
I have earlier implemented the Zxing integratiomn by use of LWUIT for my application for android, j2me and blackberry.
Here for android i have integrated the code and made Zxing as native app for the application.
How can I do the same for CodenameOne i.e use Zxing for scanning as native for android, j2me, blackbery and Iphone.
Here for android i have integrated the code and made Zxing as native app for the application.
How can I do the same for CodenameOne i.e use Zxing for scanning as native for android, j2me, blackbery and Iphone.

Chen Fishbein
May 8, 2012, 3:19:27 AM5/8/12
to codenameone...@googlegroups.com
ankit agarwal
May 8, 2012, 3:27:52 AM5/8/12
to codenameone...@googlegroups.com
Yes I have seen the blog mentioned and also tried to implement the same but when i click scan it get crash after it enter the code given in the blog.
It gets a nullPointerException..
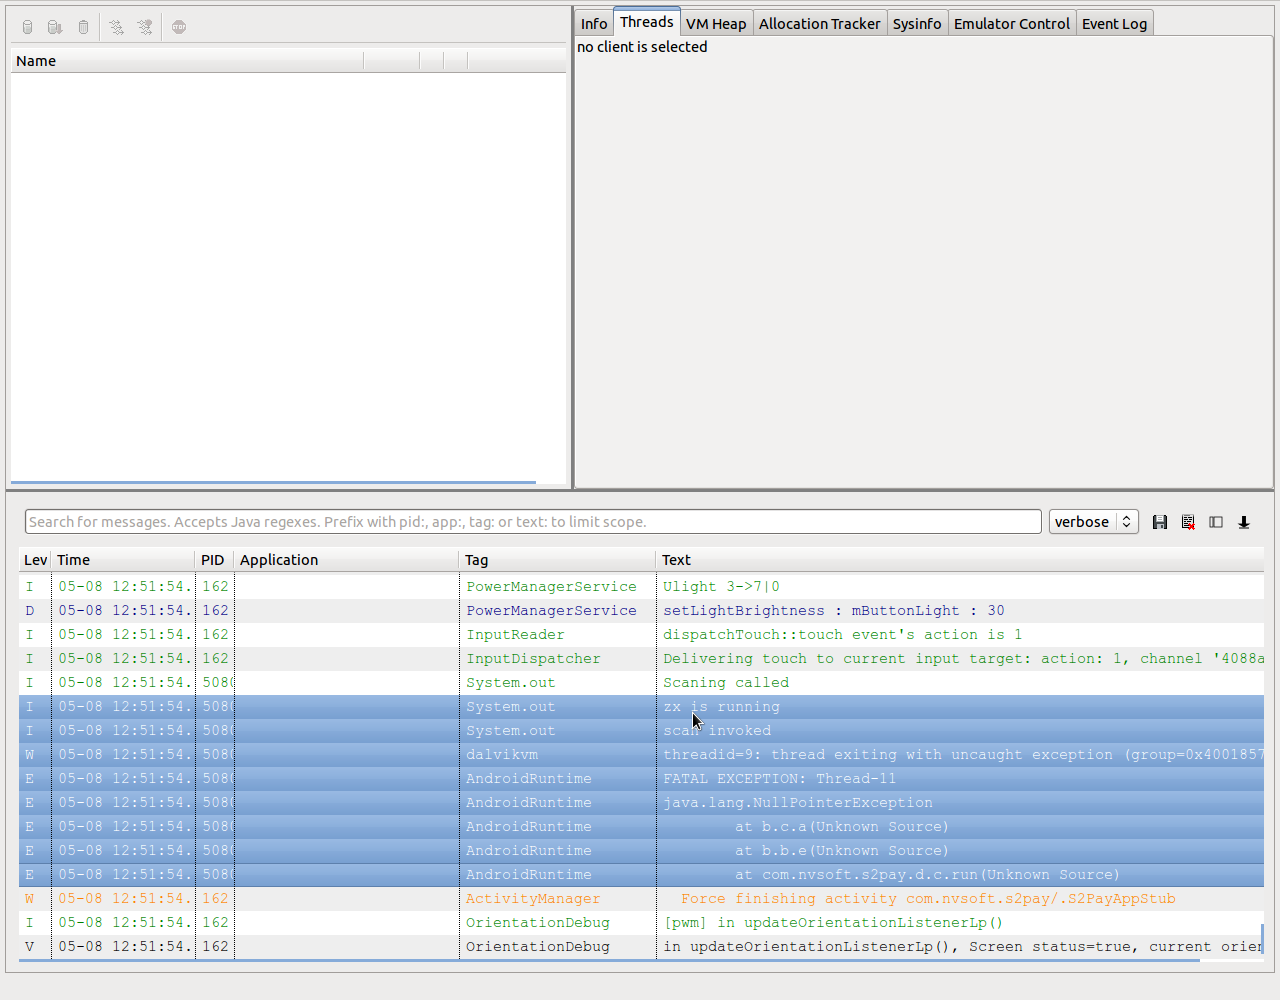
I have attached the Logs...

Shai Almog
May 8, 2012, 5:19:29 AM5/8/12
to codenameone...@googlegroups.com
Did you try the actual code committed to the SVN?
ankit agarwal
May 8, 2012, 5:31:15 AM5/8/12
to codenameone...@googlegroups.com
Yes I have tried the code from svn by integrating in my codes.
I have used the same by calling ZxingNativeCalls on button click then ZxingNativeCallsImpl code is there in the native android folder.But when i try this on the real device I get the error mentioned above.
Please help me to sort out this because scanning is the one of the core module of my application.
Shai Almog
May 8, 2012, 5:34:56 AM5/8/12
to codenameone...@googlegroups.com
Did you try the actual example?
I'm assuming you made a modification when pasting the code into your existing application. Just do some printouts and see which line is failing.
I'm assuming you made a modification when pasting the code into your existing application. Just do some printouts and see which line is failing.
ankit agarwal
May 8, 2012, 5:51:58 AM5/8/12
to codenameone...@googlegroups.com
I have done no modification while pasting the code into the existing application.
The line where it fails is in the ZxingNativeCallsImpl for the line
ctx.setIntentResultListener(new IntentResultListener()
the this returs NullPointerException..
is there any modification I need to do for the context for the zxing in my existing code..
The thing I am doing is that I have created an interface called scanner and from where i am calling ZxingNativeCalls and it fails at the line mentioned.
Shai Almog
May 8, 2012, 6:27:16 AM5/8/12
to codenameone...@googlegroups.com
Do you have the barcode reader installed?
ankit agarwal
May 8, 2012, 6:41:41 AM5/8/12
to codenameone...@googlegroups.com
yes i have tried it with both Zxing and QR-code reader for android but nothing is happening instead application get crashed.
Shai Almog
May 8, 2012, 7:54:53 AM5/8/12
to codenameone...@googlegroups.com
Did you try our project?
Did you update everything correctly.
If I understand correctly ctx is null?
If so I'm guessing you just didn't save the context passed in the init method like we did in the demo.
Did you update everything correctly.
If I understand correctly ctx is null?
If so I'm guessing you just didn't save the context passed in the init method like we did in the demo.

Eric Coolman
May 8, 2012, 12:36:01 PM5/8/12
to codenameone...@googlegroups.com
Hi Ankit. I'll be working with qrcode scanning myself over the next few days, so hopefully we can work together on this. In the meantime, could you grab the mapping.txt file from the buildserver and use Proguard to run retrace against that stack for the NPE that's showing on the log output? Hopefully that can point to the real source of the error (alternatively, could install the debug version of the build to your device to avoid the obfuscated stack).
Eric
Eric
ankit agarwal
May 9, 2012, 2:07:41 AM5/9/12
to codenameone...@googlegroups.com
Shai,
I have tried by coping the demo code exactly in my application.
Does I need to define the context elsewhere in the project and in Zxing.java do I need to instantiate statemachine.
I have updated CodenameOne from the svn..do I need to update other libraries int he existing project.
ankit agarwal
May 9, 2012, 2:10:09 AM5/9/12
to codenameone...@googlegroups.com
Eric,
I cant understand what do tou mean by use of Proguard to retrace the stack.
I am installing the debug version of the build server in the device and the logs I am getting is attached above.
I cant understand what do tou mean by use of Proguard to retrace the stack.
I am installing the debug version of the build server in the device and the logs I am getting is attached above.
ankit agarwal
May 9, 2012, 2:14:01 AM5/9/12
to codenameone...@googlegroups.com
I my using NetBeans 7.1.1 on Unix.
I am getting compile time warning at com.codename1.impl.android.CodenameOneActivity and com.codename1.impl.android.IntentresultListener as package not found, does this is affecting my application and results in crash of the application.
Eric Coolman
May 9, 2012, 3:17:29 AM5/9/12
to codenameone...@googlegroups.com
Usually when you install the debug version, your stack traces are not obfuscated, and you can see the exact line number of the source of the error. In your screenshot, it shows:
java.lang.NullPointerException
at b.c.a (UnknownSource)
at b.b.a (Unknown Source)
at com.nvsoft.s2pay.d.c.run(UnknownSource)
This is the obfuscated stacktrace, created on the build server by a tool called Proguard in the production build (If you install from the QRcode, you are installing a production build).
To see the line numbers from a production build, you can install the proguard commandline tool, download the mapping.txt file from the build server (it's in the same place you downloaded your app build), and run the command: ${proguard-home}/bin/retrace.sh mapping.txt stacktrace.txt. The retrace tool will print out proper method names and line number that look more like:
Exception in thread "main" java.lang.NullPointerException
at java.util.Hashtable.put(Hashtable.java:394)
at ca.coolman.c1.cli.PrescanDictionary.main(PrescanDictionary.java:36)
.... or, you can install a debug build and skip all that.
Shai Almog
May 9, 2012, 3:57:49 AM5/9/12
to codenameone...@googlegroups.com
That's your problem. You copied Zxing.java instead of integrating its content into your application and updating the Android code appropriately. You need to integrate the code into your lifecycle object and update the calls in the Android side.
Message has been deleted
Message has been deleted
ankit agarwal
May 11, 2012, 4:11:58 AM5/11/12
to codenameone...@googlegroups.com
The issue has been resolved.
I realized that he Context was getting Null and I have thus integrated in my project life cycle.
Thanks for the help.
I realized that he Context was getting Null and I have thus integrated in my project life cycle.
Thanks for the help.

bhargavch...@gmail.com
Aug 31, 2012, 7:41:59 AM8/31/12
to codenameone...@googlegroups.com
Does any body have the Zxing integration doc into our APP for IPHONE?
Shai Almog
Aug 31, 2012, 9:23:01 AM8/31/12
to codenameone...@googlegroups.com, bhargavch...@gmail.com
See the zxing demo in the docs & demos zip.
bhargavch...@gmail.com
Aug 31, 2012, 9:37:44 AM8/31/12
to codenameone...@googlegroups.com, bhargavch...@gmail.com
On Friday, August 31, 2012 6:53:01 PM UTC+5:30, Shai Almog wrote:
See the zxing demo in the docs & demos zip.
Hello Shai,
Thankd for your quick reply,is there any way to integrate zxing barcode reader in HTML5?
Shai Almog
Sep 2, 2012, 3:38:10 AM9/2/12
to codenameone...@googlegroups.com, bhargavch...@gmail.com
No.
Reply all
Reply to author
Forward
0 new messages