Map adaptation for GMM
781 views
Skip to first unread message

Milton Orlando Sarria Paja
Aug 28, 2013, 6:09:22 PM8/28/13
to bob-...@googlegroups.com
Dear all
Recently I started to use Bob in ubuntu, my problems are related to speaker verification and recently I noticed something that I am not sure if it is a bug or a mistake in my code, I did not notice this the first time I posted a problem related also with map adaptation. Here I detail the procedure:
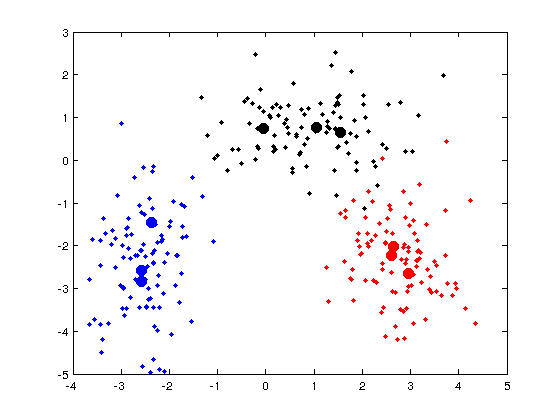
1) I generated artificial 2-D data using matlab, and saved the files in HDF5 format. The data is generated such that there are three classes or groups (X,Y,Z)
2) Then using the bob.io.HDF5File tool I loaded it for processing in python
3) The K-means trainer was used to initialize the GMM means. with K=3 clusters
5) By using the means and the available data, the bob.trainer.ML_GMMTrainer was used to estimate the universal GMM (UBM), and the model I will use to adapt to each class
6) Data from each class (X,Y,Z) was used to compute the MAP estimate of gmmX, gmmY and gmmZ
7) The updated means are saved in a file to visualize and compare with the results from Matlab
I am also attaching the artificial data "toy_data.h5", the python code "GMM_map_toy_data.py" and some plots comparing results.
First of all the results from matlab and bob show that the EM algorithm estimates the three klusters fairly well, and there is no big difference in the UBM means. However when the adaptation takes place, we can see that in the matlab procedure the means move to a new configuration, perhaps not the three means, but in each case we see that at leas two (out of three) means were asigned to each class. In the map adaptation procedure using Bob the means do not move to a new configuration, and they remain almost with the same original values or in the same neighbourhood.
I was careful and tried different values of the parameters such as the relevance factor, number of iterations or even the number of gaussians, but always the results were similar
If someone know what is going on and how to properly do the adaptation, I will really appreciate the help
thanks
best regards
Recently I started to use Bob in ubuntu, my problems are related to speaker verification and recently I noticed something that I am not sure if it is a bug or a mistake in my code, I did not notice this the first time I posted a problem related also with map adaptation. Here I detail the procedure:
1) I generated artificial 2-D data using matlab, and saved the files in HDF5 format. The data is generated such that there are three classes or groups (X,Y,Z)
2) Then using the bob.io.HDF5File tool I loaded it for processing in python
3) The K-means trainer was used to initialize the GMM means. with K=3 clusters
5) By using the means and the available data, the bob.trainer.ML_GMMTrainer was used to estimate the universal GMM (UBM), and the model I will use to adapt to each class
6) Data from each class (X,Y,Z) was used to compute the MAP estimate of gmmX, gmmY and gmmZ
7) The updated means are saved in a file to visualize and compare with the results from Matlab
I am also attaching the artificial data "toy_data.h5", the python code "GMM_map_toy_data.py" and some plots comparing results.
First of all the results from matlab and bob show that the EM algorithm estimates the three klusters fairly well, and there is no big difference in the UBM means. However when the adaptation takes place, we can see that in the matlab procedure the means move to a new configuration, perhaps not the three means, but in each case we see that at leas two (out of three) means were asigned to each class. In the map adaptation procedure using Bob the means do not move to a new configuration, and they remain almost with the same original values or in the same neighbourhood.
I was careful and tried different values of the parameters such as the relevance factor, number of iterations or even the number of gaussians, but always the results were similar
If someone know what is going on and how to properly do the adaptation, I will really appreciate the help
thanks
best regards

Laurent El Shafey
Aug 28, 2013, 6:40:47 PM8/28/13
to bob-...@googlegroups.com
Hello,
Thanks for the detailed report. I will provide you a quick answer before
moving to bed.
The behavior that you observe looks correct to me. The MAP adaptation
implemented in Bob (the default one) is the relevance map adaptation
described in the following article from Doug Reynolds:
http://speech.ee.ntu.edu.tw/previous_version/Speaker%20Verification%20Using%20Adapted%20Gaussain%20Mixture%20Models.pdf
When you use this adaptation, the means close to the enrollment samples
are adapted, whereas the other ones (far from the enrollment samples) are
not (cf. figure 3 of the paper mentioned above, and equation 8 and 14). In
your toy example, this is exactly the behavior that your observe.
If you can tell us which adaptation technique is used in the matlab
implementation you are using, it might help us to understand, why the
results are different.
What you could also try to do is to set the relevance factor to 0, and
generate the plots again.
Cheers,
Laurent
> --
> -- You received this message because you are subscribed to the Google
> Groups bob-devel group. To post to this group, send email to
> bob-...@googlegroups.com. To unsubscribe from this group, send email
to
> bob-devel+...@googlegroups.com. For more options, visit this
group
> at https://groups.google.com/d/forum/bob-devel or directly the project
> website at http://idiap.github.com/bob/
> ---
> You received this message because you are subscribed to the Google
Groups
> "bob-devel" group.
> To unsubscribe from this group and stop receiving emails from it, send
an
> email to bob-devel+...@googlegroups.com.
> For more options, visit https://groups.google.com/groups/opt_out.
Thanks for the detailed report. I will provide you a quick answer before
moving to bed.
The behavior that you observe looks correct to me. The MAP adaptation
implemented in Bob (the default one) is the relevance map adaptation
described in the following article from Doug Reynolds:
http://speech.ee.ntu.edu.tw/previous_version/Speaker%20Verification%20Using%20Adapted%20Gaussain%20Mixture%20Models.pdf
When you use this adaptation, the means close to the enrollment samples
are adapted, whereas the other ones (far from the enrollment samples) are
not (cf. figure 3 of the paper mentioned above, and equation 8 and 14). In
your toy example, this is exactly the behavior that your observe.
If you can tell us which adaptation technique is used in the matlab
implementation you are using, it might help us to understand, why the
results are different.
What you could also try to do is to set the relevance factor to 0, and
generate the plots again.
Cheers,
Laurent
> -- You received this message because you are subscribed to the Google
> Groups bob-devel group. To post to this group, send email to
> bob-...@googlegroups.com. To unsubscribe from this group, send email
to
> bob-devel+...@googlegroups.com. For more options, visit this
group
> at https://groups.google.com/d/forum/bob-devel or directly the project
> website at http://idiap.github.com/bob/
> ---
> You received this message because you are subscribed to the Google
Groups
> "bob-devel" group.
> To unsubscribe from this group and stop receiving emails from it, send
an
> email to bob-devel+...@googlegroups.com.
> For more options, visit https://groups.google.com/groups/opt_out.
Milton Orlando Sarria Paja
Aug 28, 2013, 8:03:26 PM8/28/13
to bob-...@googlegroups.com, laurent....@idiap.ch
Thanks Laurent
for your fast response
In fact I am using the same paper as reference for my matlab implementation, and you are rigth, I was observing the behaviour you describe in the matlab implementation but not with one implemented in Bob. In fact, the plot shows the three means after adaptation, they move only a little bit in the same neighbourhood.
Any way, the good news is that using a relevance factor equal to zero, I got the plot I am attaching and it shows the behaviour I was expecting. Thanks a lot.
I suppose there are some small differences in the implementation, because if I set relevance factor higher to 5 the update is not as good as the one I got in matlab, and the results are very different if the relevance factor is higher (lets say 15 or 20) as you can see in the previous results. In that case I was setting the relevance factor to 16 as it is recommended in the paper.
Again, thank you very much for your time
best regards

Elie Khoury
Aug 28, 2013, 8:13:51 PM8/28/13
to bob-...@googlegroups.com
Dear Milton,
We typically use a relevance factor of 4 for our Bob implementation, contrarily to the recommendation in Doug's paper.
By the way, we are about to release (next week) a Bob satellite package on state-of-the-art speaker recognition tools. I thought this might be useful for you.
Best regards,
Elie.
We typically use a relevance factor of 4 for our Bob implementation, contrarily to the recommendation in Doug's paper.
By the way, we are about to release (next week) a Bob satellite package on state-of-the-art speaker recognition tools. I thought this might be useful for you.
Best regards,
Elie.
--
--------------------
Elie Khoury
Post Doctorant
Biometric Person Recognition Group
Idiap Research Institute
Switzerland
CH : +41 27 721 77 23
M. Sarria-Paja
Aug 28, 2013, 8:26:24 PM8/28/13
to bob-...@googlegroups.com
Thank you very much Elie for the advance
I will be expecting this new releaseYou received this message because you are subscribed to a topic in the Google Groups "bob-devel" group.
To unsubscribe from this topic, visit https://groups.google.com/d/topic/bob-devel/TUmCQgE30KA/unsubscribe.
To unsubscribe from this group and all of its topics, send an email to bob-devel+...@googlegroups.com.
--
Milton Orlando Sarria Paja
INRS - EMT
Reply all
Reply to author
Forward
0 new messages