Too many pending requests consistently
296 views
Skip to first unread message

Shrijeet Paliwal
Nov 9, 2012, 2:58:59 PM11/9/12
to AsyncHBase
Hi,
Pardon me since I have raised this before & for too many posts in general lately.
I am still not clear on how client buffers & limits pending requests in case server crashes for brief moment. My sample code is here.
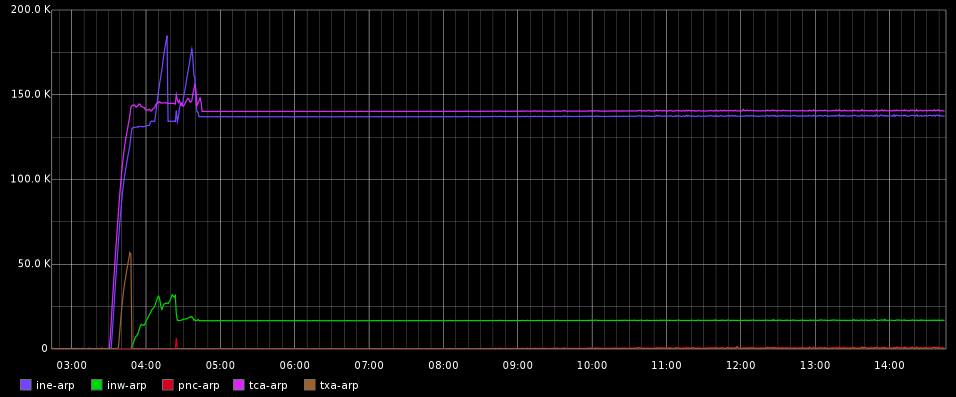
My application writes to multiple data centers. The plot is showing number of pending writes per data center (PutRequests for which success/failure callback has not been called yet, code snippet shows how this counter is being maintained in detail.). At around 3:40AM EST connectivity to bunch of data centers was lost, the effect is visible in plot. The glitch was short. But pending counter never settled back to normal state. A graph to demonstrate my claim follows at the end. The client log is attached. Debug was not on unfortunately.
My questions are :
1) Why do I have pending count so high consistently for hours? Did certain RPCs get lost with no accounting? If the max RPC pending at any point of time is 10K per region (per the thread I quoted earlier), does it mean that certain regions have hit the limit and not being able to recover from that point? This brings me to my next two questions.
2) Am I maintaining counters incorrectly ? I am decrementing them for both success and failure case. But is there a third case which is possible when using Deferred.group() call ?
3) If server is not able to keep up with client an org.hbase.async.PleaseThrottleException is thrown, but the application did not observer any such exception. If the consistent state of too many pending writes is due to server not being able to keep up, shouldn't we see it many times?
4) The client.stats() function does not seem to expose the global counter of pending RPCs across all region clients (here by pending I mean pending due to any reason). It could help to match that counter with counter application is maintaining.
--
Shrijeet
PS: The attached log shows some warnings that there are 'There are now N RPCs pending due to NSRE on...' , I spot checked and found those warnings are not for data centers where count is too high since 4AM.

tsuna
Nov 10, 2012, 4:07:39 AM11/10/12
to Shrijeet Paliwal, AsyncHBase
On Fri, Nov 9, 2012 at 11:58 AM, Shrijeet Paliwal
<shrijeet...@gmail.com> wrote:
> Pardon me since I have raised this before & for too many posts in general
> lately.
No need to apologize, this is totally fine.
<shrijeet...@gmail.com> wrote:
> Pardon me since I have raised this before & for too many posts in general
> lately.
> I am still not clear on how client buffers & limits pending requests in
> case server crashes for brief moment. My sample code is here.
region name, and the value is a list of pending RPCs. Each list, for
each region, is capped at 10k pending RPCs. That's all.
> My application writes to multiple data centers. The plot is showing number
> of pending writes per data center (PutRequests for which success/failure
> callback has not been called yet, code snippet shows how this counter is
> being maintained in detail.). At around 3:40AM EST connectivity to bunch of
> data centers was lost, the effect is visible in plot. The glitch was short.
BTW there are a number of spurious ClosedChannelExceptions in that
log, I committed
https://github.com/tsuna/asynchbase/commit/8ce7aa2c8e6f1dffc76c31dcea6b9c7fe14b3749
to remove them and filed a bug against Netty.
There was a bunch of connection timeouts around 03:47. Around 03:51,
the first "connection reset by peer" shows up, indicating that the
other side has crashed (and the kernel RST'ing TCP connections to a
closed port). There is also a number of cases where we successfully
connect to the other side, but the connection gets reset in the middle
of an RPC ("ERROR org.hbase.async.RegionClient - After decoding the
last message on [xxx], there was still some undecoded bytes in the
channel's buffer (which are going to be lost)"). This lasted until
04:37, so a one hour outage in total.
> 1) Why do I have pending count so high consistently for hours? Did certain
> RPCs get lost with no accounting?
> If the max RPC pending at any point of
> time is 10K per region (per the thread I quoted earlier), does it mean that
> certain regions have hit the limit and not being able to recover from that
> point?
buffering indefinitely. Should still be able to recover from that.
> This brings me to my next two questions.
>
> 2) Am I maintaining counters incorrectly ? I am decrementing them for both
> success and failure case. But is there a third case which is possible when
> using Deferred.group() call ?
Deferred.group(): either the callback or the errback should eventually
fire. In your case it seems that neither fired.
> 3) If server is not able to keep up with client an
> org.hbase.async.PleaseThrottleException is thrown, but the application did
> not observer any such exception. If the consistent state of too many pending
> writes is due to server not being able to keep up, shouldn't we see it many
> times?
doesn't log it anywhere, but yes it should run through your errback.
> 4) The client.stats() function does not seem to expose the global counter
> of pending RPCs across all region clients (here by pending I mean pending
> due to any reason). It could help to match that counter with counter
> application is maintaining.
noSuchRegionExceptions(). However yes there is currently nothing to
tell you how many RPCs are waiting right now in any retry buffer.
These are a little hard and expensive to count.
It very much looks like you're hitting a bug, however without more
information or reproducing it myself, I'm not sure what to say. I
will try to reproduce it by starting up a client and sending a
continuous stream of RPCs to a cluster and adding a firewall rule to
drop all traffic to HBase.
--
Benoit "tsuna" Sigoure
Shrijeet Paliwal
Nov 10, 2012, 1:28:13 PM11/10/12
to tsuna, AsyncHBase
I checked two cluster (for which pending was highest) namely ine-arp & tca-arp.
ine-arp had one region split in that window. tca-arp had none.
Here is how I am counting split https://gist.github.com/4052020 (is there any other way?)
--
Shrijeet
--
Shrijeet
On Sat, Nov 10, 2012 at 10:07 AM, tsuna <tsun...@gmail.com> wrote:
On Sat, Nov 10, 2012 at 10:01 AM, Shrijeet PaliwalIn theory yes, they should have. There may be a bug where by the
<shrijeet...@gmail.com> wrote:
> On RPCs vanishing in thin air, even though the pending count was at 150K for
> few remote sites - new write requests were successfully finishing (I did
> spot checks by sending sample requests). If client indeed had a long list
> waiting to be taken care of, these new requests should've been batched up
> behind the old ones.
client "forgets" that it had RPCs that needed to be retried.
Do you know whether there were any region splits while the cluster was
unreachable?
--
Benoit "tsuna" Sigoure
tsuna
Nov 10, 2012, 2:40:19 PM11/10/12
to Shrijeet Paliwal, AsyncHBase
On Sat, Nov 10, 2012 at 10:28 AM, Shrijeet Paliwal
<shrijeet...@gmail.com> wrote:
> I checked two cluster (for which pending was highest) namely ine-arp &
> tca-arp.
> ine-arp had one region split in that window. tca-arp had none.
>
> Here is how I am counting split https://gist.github.com/4052020 (is there
> any other way?)
Never counted them this way, but that sounds like a good way to count them.
<shrijeet...@gmail.com> wrote:
> I checked two cluster (for which pending was highest) namely ine-arp &
> tca-arp.
> ine-arp had one region split in that window. tca-arp had none.
>
> Here is how I am counting split https://gist.github.com/4052020 (is there
> any other way?)
--
Benoit "tsuna" Sigoure
Reply all
Reply to author
Forward
0 new messages