Y axis scale of wavelet_PSD()
11 views
Skip to first unread message

ra...@janmedical.com
Sep 8, 2016, 8:45:12 PM9/8/16
to astroML-general
I'm a bit confused, as some of the examples shows linear Y scales
and another log
So, what is the natural scale of wavelet_PSD() ?
Here I set the Y tick labels to log(10) of min Y to max Y with np.logspace(), but I'm suspicious of the result (attached)
        fig, ax = plt.subplots(1, 1)
        N = len(self.td)
        t = np.linspace(-N/(2*2560.), N/(2*2560.), N)
        #------------------------------------------------------------
        # Compute the wavelet PSD
        f0 = np.linspace(self.sliderLowFrequency.GetValue()/10.,
                        self.sliderHighFrequency.GetValue()/10.,
                        self.sliderNBins.GetValue())
        this_Q = self.sliderQ.GetValue()/10.
        wPSD = wavelet_PSD(t, self.td, f0, Q=this_Q)
        self.dataMin = wPSD.min()
        self.dataMax = wPSD.max()
        # the spectrogram
        self.ax = plt.subplot(111)
        self.ax.set_yticks(np.linspace(0, self.sliderNBins.GetValue(), 8))
        ytl = np.logspace(np.log(f0[0])/np.log(10),
                        np.log(f0[-1])/np.log(10), 8,
                        endpoint=True, base=10.0)
        self.ax.set_yticklabels([round(y,3) for y in ytl])
        self.imshow_obj = self.ax.imshow(wPSD,
                            origin='lower',
                            aspect='auto',
                            cmap=matplotlib.cm.get_cmap(name=self.choiceColorMap.GetStringSelection()),
                            interpolation=self.choiceInterpolation.GetStringSelection(),
                            vmin=self.dataMin+((self.dataMax-self.dataMin)*self.sliderLumMin.GetValue()/100.),
                            vmax=self.dataMax-((self.dataMax-self.dataMin)*(1-self.sliderLumMax.GetValue()/100.)),
                            alpha=1.)
        plt.colorbar(self.imshow_obj, orientation='vertical')
        #plt.tight_layout()
        self.ax.text(0.02, 0.95, ("Wavelet PSD"), color='w',
                ha='left', va='top', transform=ax.transAxes)
        self.ax.set_xlabel('$t$')
        self.ax.set_ylabel('$f$ bin')
        plt.show(False)
        plt.draw()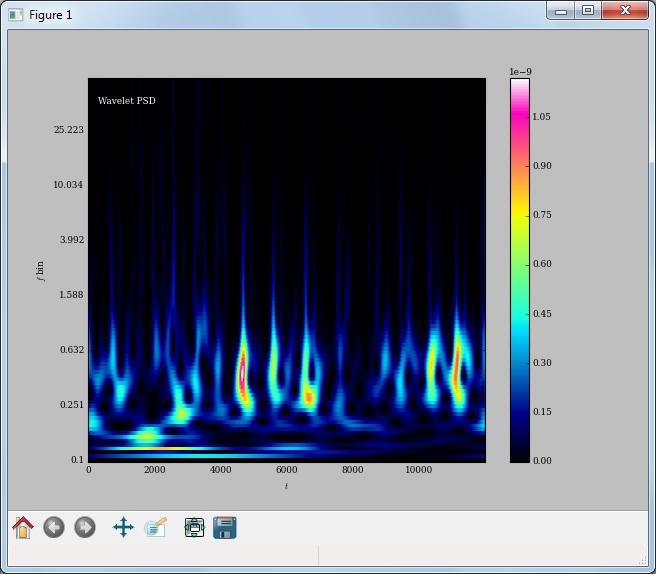
ra...@janmedical.com
Sep 9, 2016, 8:28:34 PM9/9/16
to astroML-general
I think I have confirmed via known stationary signals that the Y scale is linear in the generated output array.
Reply all
Reply to author
Forward
0 new messages