Akka Default Dispatcher creating 9000+ Worker Threads!!
306 views
Skip to first unread message

abhi...@zilingo.com
Jan 16, 2018, 4:46:07 PM1/16/18
to Akka User List
Hey Folks,
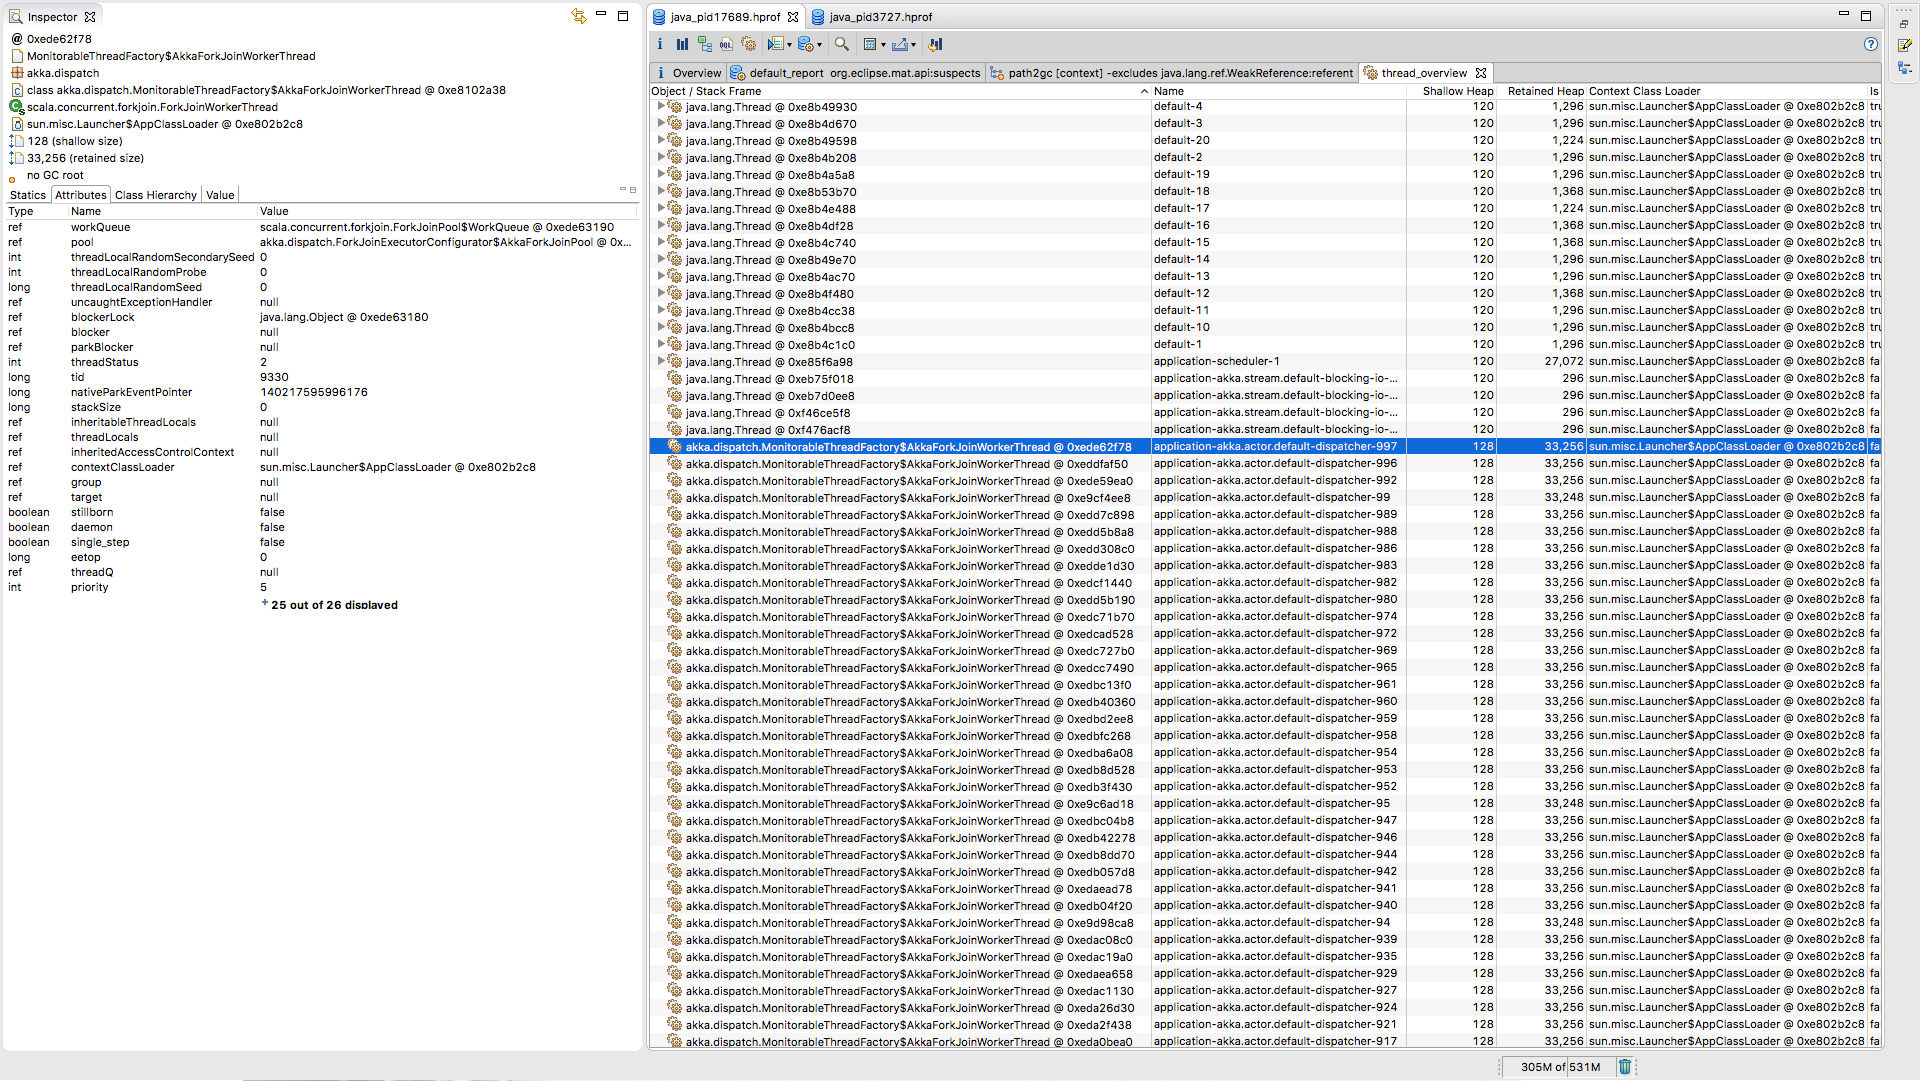
I've been working on a service thats built on Scala + Play (2.5.3), which also makes some use of Akka actors (with no remote-ing). Recently i've noticed that the service intermittently goes down due to OOM. Looked up the .hprof dump files (set to be created on OOM failures) and it appears that 9000+ (!) worker threads (akka.dispatch.MonitorableThreadFactory$AkkaForkJoinWorkerThread) were created named 'application-akka.actor.default-dispatcher-xxxx'. Additionally, all these worker threads have no stack trace or a history of any task assigned to them.
I've been working on a service thats built on Scala + Play (2.5.3), which also makes some use of Akka actors (with no remote-ing). Recently i've noticed that the service intermittently goes down due to OOM. Looked up the .hprof dump files (set to be created on OOM failures) and it appears that 9000+ (!) worker threads (akka.dispatch.MonitorableThreadFactory$AkkaForkJoinWorkerThread) were created named 'application-akka.actor.default-dispatcher-xxxx'. Additionally, all these worker threads have no stack trace or a history of any task assigned to them.
Refer attached .csv of Eclipse Memory Analyzer's thread summary.
Note :
1) I haven't defined any custom Dispatcher / Execution Context / Thread Pool.
2) As per Play's docs, i've ensured that ActorSystems are only injected and never created, hence only play's default actor system is used.
I assumed that a max of 64 threads would be created since only the default actor system was used, but these many threads is very strange.
Any help with analysing this issue would be great, more specifically any advice on how to ascertain how/why these 'ghost' workers threads are created would be super useful. Any tools to monitor creation of worker threads by Akka Dispatcher?
-- Abhilash

Akka Team
Jan 30, 2018, 4:56:55 AM1/30/18
to Akka User List
If you use Await.result, Await.ready or surround logic with scala.concurrent#blocking and use a FJP dispatcher, that will fork unbounded amounts of threads for those blocks, so that could perhaps explain why you are seing so many thread. Looking at stack dumps should show you what those threads are doing. If this is the problem the solution would be to not block or to run such things on a separate thread pool based dispatcher.
--
Johan
Akka Team
--
>>>>>>>>>> Read the docs: http://akka.io/docs/
>>>>>>>>>> Check the FAQ: http://doc.akka.io/docs/akka/current/additional/faq.html
>>>>>>>>>> Search the archives: https://groups.google.com/group/akka-user
---
You received this message because you are subscribed to the Google Groups "Akka User List" group.
To unsubscribe from this group and stop receiving emails from it, send an email to akka-user+unsubscribe@googlegroups.com.
To post to this group, send email to akka...@googlegroups.com.
Visit this group at https://groups.google.com/group/akka-user.
For more options, visit https://groups.google.com/d/optout.
Konrad “ktoso” Malawski
Jan 30, 2018, 4:59:42 AM1/30/18
to akka...@googlegroups.com, Akka Team
Please read the docs about this effect here: https://doc.akka.io/docs/akka/current/dispatchers.html#blocking-needs-careful-management
It’s the Fork Join Pools (JDK) reaction to doing “bad things”™ (blocking) to it.
The solution is as Johan explained.
To unsubscribe from this group and stop receiving emails from it, send an email to akka-user+...@googlegroups.com.
Reply all
Reply to author
Forward
0 new messages