writing multidimensional data to netcdf for space-varying z coordinate, usign xArray

Marco Miani
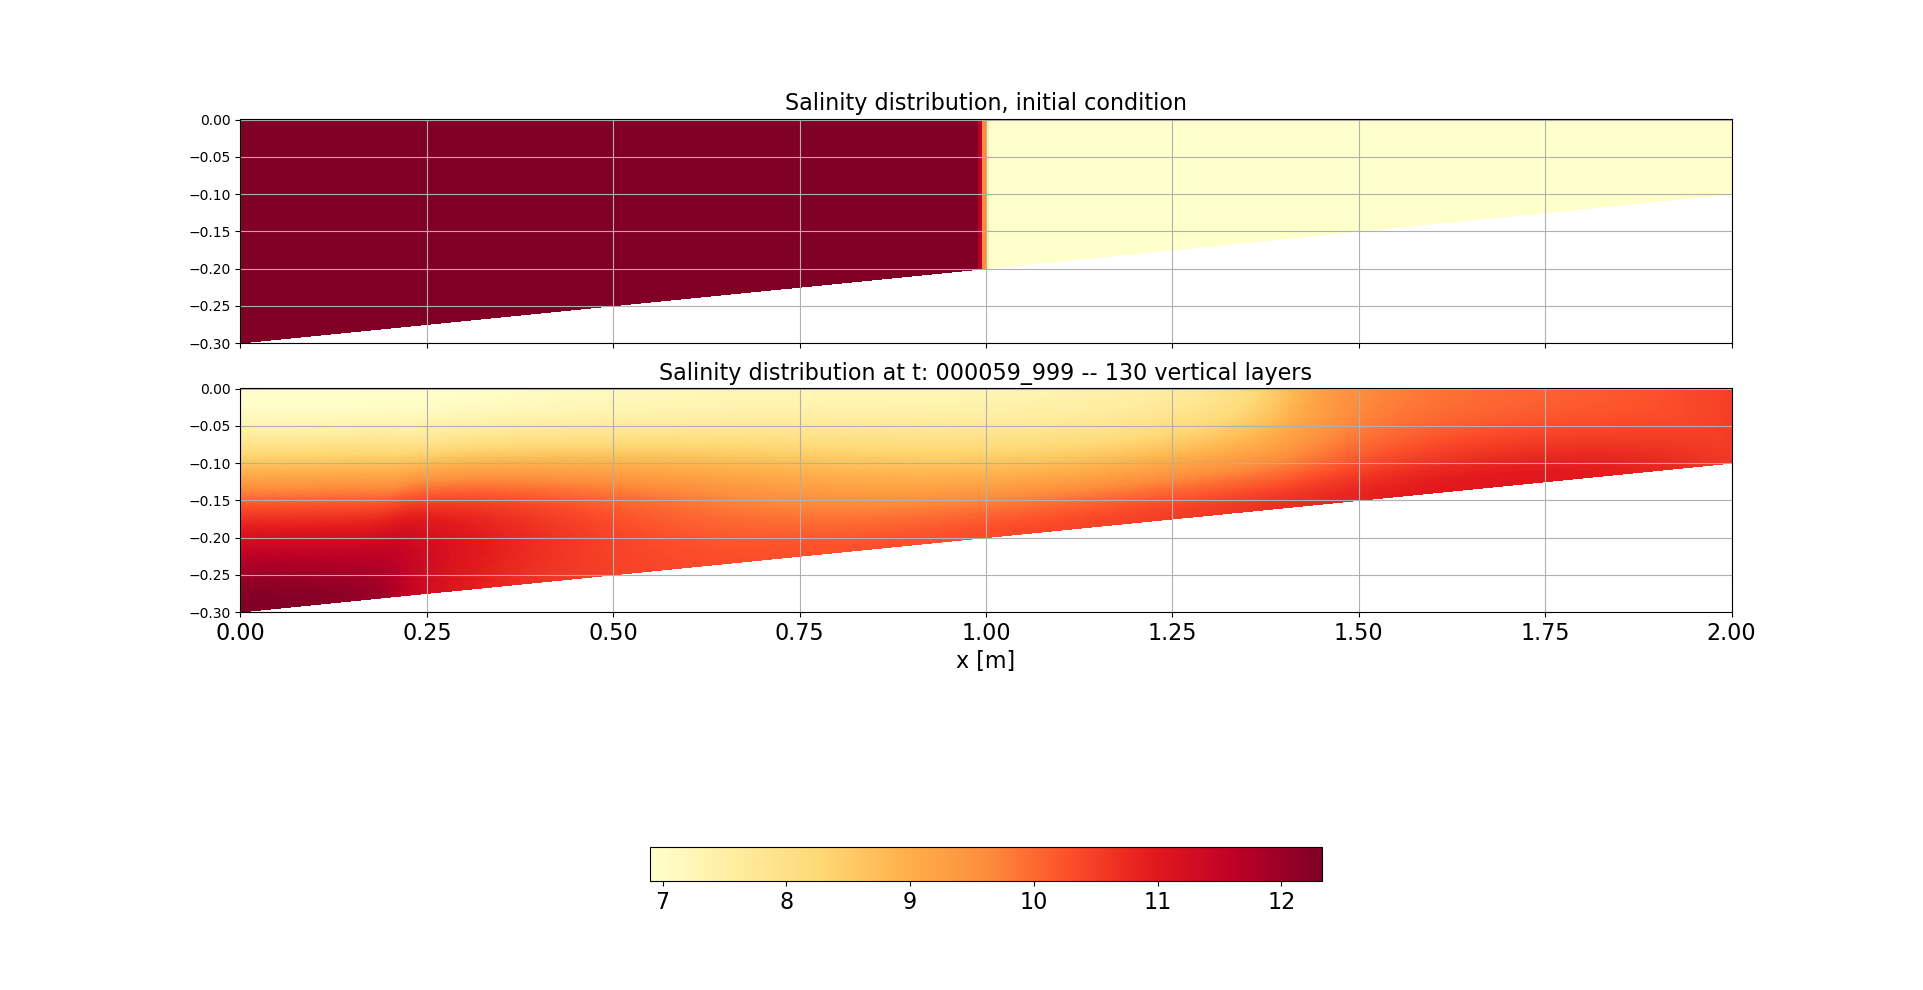
- Sal stands for salinity
- k100 stands for the number of layer
- 000000_000 is the time-step in HHMMSS_mms (thus here, initial condition)
- Therefore, Xp will be stacked (concatenated vertically) so to have the same size of Salk100_000_000. This is easy, I am just copying Xp and piling it up.
- zk_100_0000_000 is varying. So, for that timestep, I need to loop over all k levels and stack them together. for k in range(0,100): new_zk=.....
Or should I include another dimension when preallocating data?
I am also sharing my so far written Python code for pre/post-post processing, as well as the model-generated data (zipped file attached to this email)
Have a happy and sunny day
Marco
I

Ryan Abernathey
--
You received this message because you are subscribed to the Google Groups "xarray" group.
To unsubscribe from this group and stop receiving emails from it, send an email to xarray+un...@googlegroups.com.
To view this discussion on the web visit https://groups.google.com/d/msgid/xarray/2db0fdc1-990e-4545-b218-b5d32c74fcafn%40googlegroups.com.
Marco Miani
Marco
To view this discussion on the web visit https://groups.google.com/d/msgid/xarray/CAJAZx5A9JAFbLzFWRMue_ZwzGpot6V0sSHOsAFvP4A%2B7WgJQJw%40mail.gmail.com.
Marco Miani
Does anyone have any idea of how to generate, in python/x-array, the netcdf file (or a similar equivalent) to the one presented in this following example, shown on the official webpage?
ds = xr.tutorial.open_dataset('rasm') ##---rasm.nc!
--

Deepak Cherian
Take a look at xr.full_like, xr.zeros_like, xr.ones_like but it will be hard to change sizes.
The first example here:
https://xarray.pydata.org/en/stable/data-structures.html#creating-a-dataset,
seems like it creates what you want.
Deepak
To view this discussion on the web visit https://groups.google.com/d/msgid/xarray/CABjf4Fi8dV8wZ0f-05J7r_zwctnmtaPLLu39_YWgrM84x8YhHw%40mail.gmail.com.
Marco Miani
From xarray:
To view this discussion on the web visit https://groups.google.com/d/msgid/xarray/9a9b96c5-b92d-43ab-247c-2c8e353c59da%40gmail.com.
Deepak Cherian
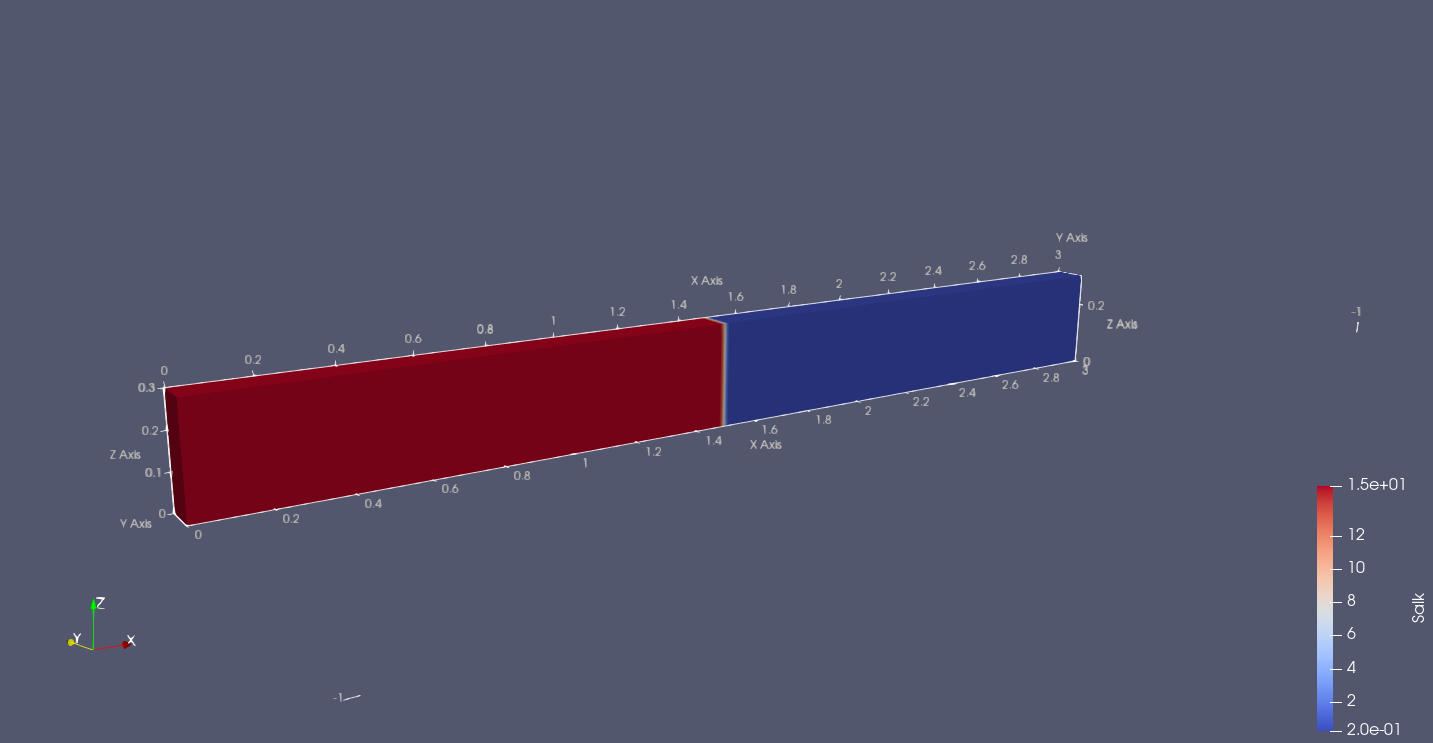
But still it doesn't seem to work, when visualizing in paraview.
What does this mean? Paraview doesn't recognize the logical
coordinates? You may need to specify .attrs["coordinates"]
appropriately.
Marco Miani
ncdump -h from_scratch.nc
netcdf from_scratch {
dimensions:
time = 100 ;
y = 12 ;
x = 500 ;
variables:
double salinity(time, y, x) ;
salinity:_FillValue = NaN ;
salinity:coordinates = "yc xc" ;
int64 time(time) ;
time:units = "days since 2014-09-06 00:00:00" ;
time:calendar = "proleptic_gregorian" ;
double xc(y, x) ;
xc:_FillValue = NaN ;
xc:axis = "X" ;
xc:long_name = "x-coordinate in Cartesian system" ;
xc:units = "m" ;
double yc(y, x) ;
yc:_FillValue = NaN ;
yc:axis = "Z" ;
yc:long_name = "sigma" ;
yc:positive = "down" ;
yc:units = "m" ;
// global attributes:
:convention = "CF-1.4" ;
--
You received this message because you are subscribed to the Google Groups "xarray" group.
To unsubscribe from this group and stop receiving emails from it, send an email to xarray+un...@googlegroups.com.
To view this discussion on the web visit https://groups.google.com/d/msgid/xarray/9aed84b5-5627-f4d6-1d82-c74bc4830deb%40gmail.com.

Bane Sullivan
To have ParaView show the data on the correct XZ plane (as is, without altering the data), you can do a representation rotation (see attached screenshot). To do this, search for “transformation” on the properties of the loaded dataset and apply a 90-degree rotation about the X-axis.
Marco Miani
Have a great day ahead.
Marco
To view this discussion on the web visit https://groups.google.com/d/msgid/xarray/4bbadf70-4a8a-406b-99aa-2c539cd120afn%40googlegroups.com.
Bane Sullivan
Marco Miani
M.
To view this discussion on the web visit https://groups.google.com/d/msgid/xarray/d88ec5de-6ac4-4daf-98a8-8107db3cee03n%40googlegroups.com.