Whole channels instead of snippets of channels

Heitor Carvalho
Hi every one
I am developing a routine in R language that will allow me to generate the results of morphometric parameters of watershed.
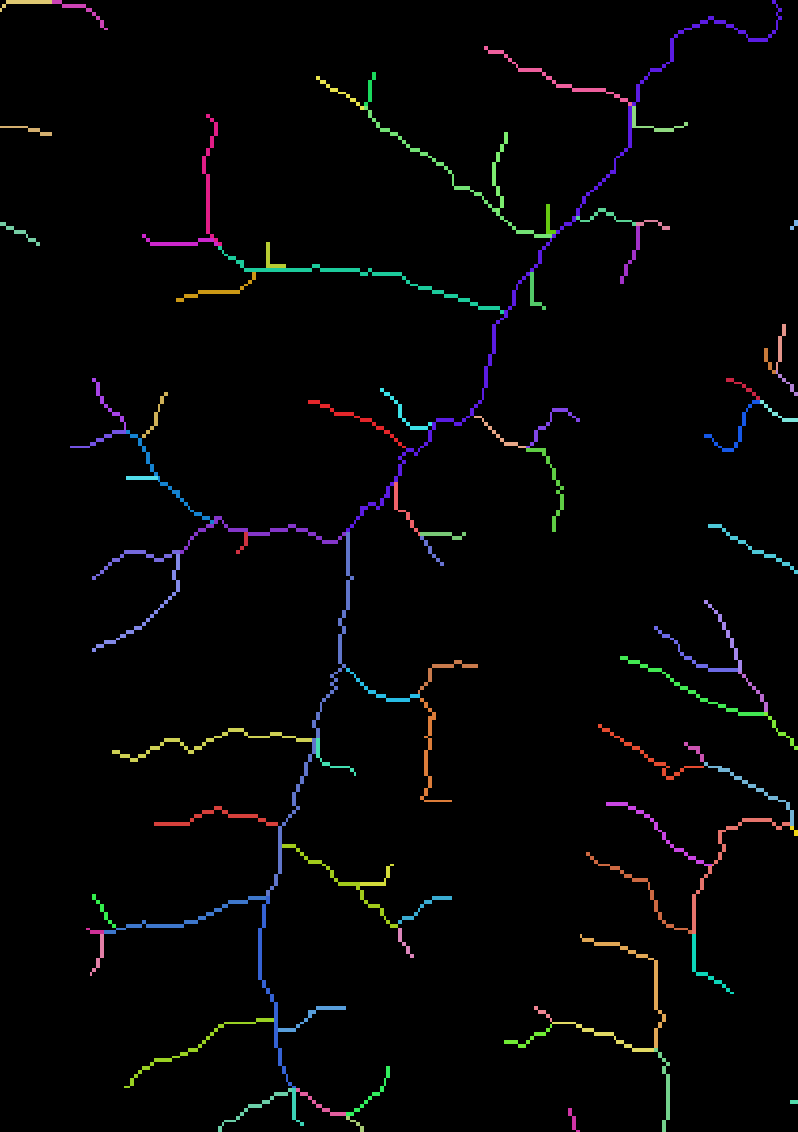
I need to perform a drainage hierarchy using the Strahler method and later transform this raster (.tiff) information into a vector (.shp). So far so good! The problem is when I transform to a vector file (shapefile) the drainages are presented in a drainage sequence, that is, third-order drainage has several sections instead of just 1. My objective is that each order of drainage is an object. Thus, the file will allow me to calculate the average length of drainages of orders 1, 2, 3... Among other processes, I need this information.
Could you point me to a function that does this procedure? Or another alternative to solve my problem? Thank you in advance for your attention.
Sincerely,
Heitor C. Lacerda.

Whitebox Geospatial Inc
Hello Heitor,
Thank you for your email. I believe that it is more normal to perform stream network analysis using the stream-link graph, where stream links begin and end at confluences (or channel heads). This is the basis of all of the stream network analysis tools in WBT, including the StrahlerOrder tool. However, as you note, when you run the StrahlerOrder tool, you are likely to have several places where the stream order of upstream-downstream links is the same. If you want to treat these as the same features, rather than their stream-link representation, then I would suggest the following method, although note that it works on the raster, rather than the vector:
1. Run the StrahlerOrder tool on your stream network to get the pattern of Strahler stream orders for each link.

2. Run the TributaryIdentifier tool to identify the tributary numbers of each link. Tributaries run from their source (outlet or confluence) to the farthest upstream channel head.

3. Multiply the Straher order and tributary rasters.
4. Clump the output of step 3 to provide a unique identifier for each tributary/stream order combination.
5. Run the StreamLinkLength tool, using the output from step 4 as the input link ID. This will allow you to measure the length of each link of continuously equal Strahler order.
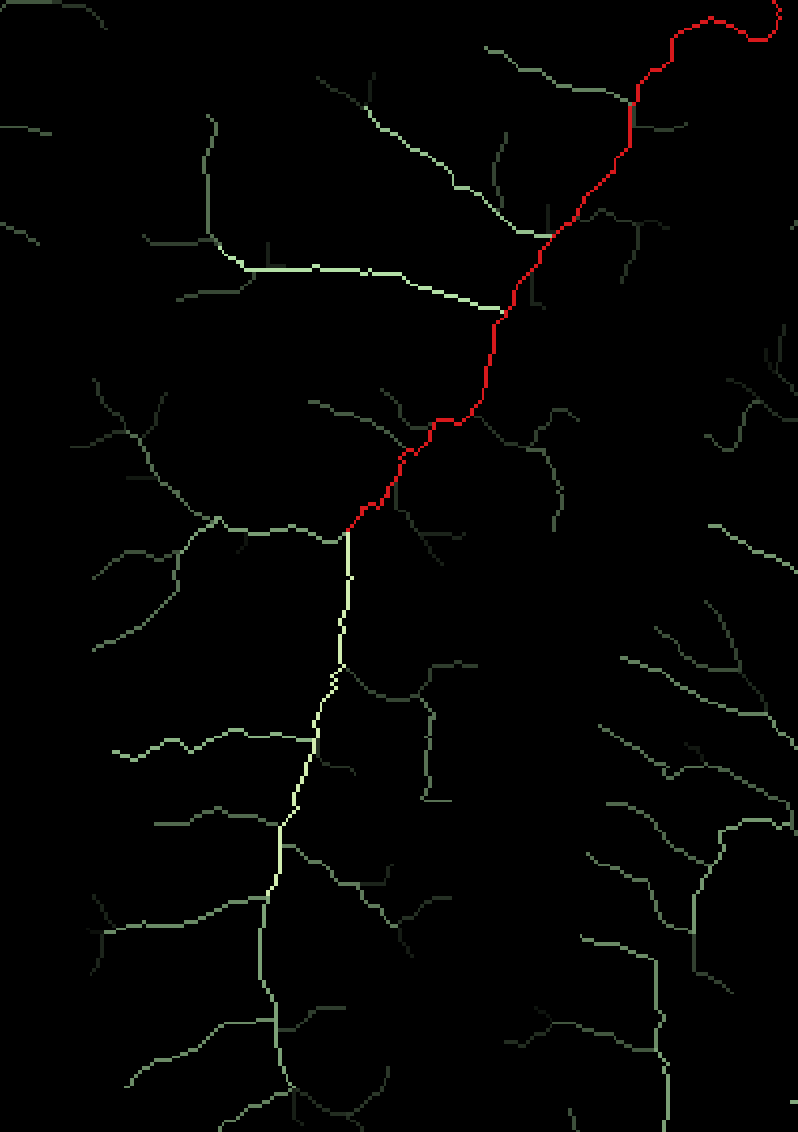
That’s it. If you are looking for the numeric data, you can always run the ZonalStatistics tool with the table output. Using the output of step 5 as the data image and the output of step 4 as the feature definition image. And of course, you can always vectorize the network afterwards for visualization if that is important for your application. I hope that helps and best of luck.
Regards,
John Lindsay
--
You received this message because you are subscribed to the Google Groups "WhiteboxTools" group.
To unsubscribe from this group and stop receiving emails from it, send an email to whiteboxtool...@googlegroups.com.
To view this discussion on the web visit https://groups.google.com/d/msgid/whiteboxtools/42730c33-9568-41f2-aa4c-7ab40d6cd465n%40googlegroups.com.
For more options, visit https://groups.google.com/d/optout.
Heitor Carvalho
I will apply this procedure on my data, thank you for your explanation. And congratulations on the "whitebox" package, it is very useful and easy to use.