weewx - weewx-influx - grafana
2,778 views
Skip to first unread message

Christian Peters
Aug 16, 2017, 5:31:59 PM8/16/17
to weewx-user
Hi all,
thanks for weewx and mwall for the quick fix and his great InluxDB plugin.
Here is my quick and dirty grafana weewx test page.
Not really a replacement for a skin but a really nice addition to explore and display
wheather data of your weewx station. As the time range of the data which should be displayed is free to set you can
display all time ranges you want (yesterday, two weeks, last two month, last six hours etc,).
Really nice....and easy to push custom data into InfluxDB (e.g. by telegraf and exec input plugin).
Regards,
Christian

Yves Martin
Aug 17, 2017, 8:06:34 AM8/17/17
to weewx-user
Great design! Where can we get this?
YMartin.com/meteo

vince
Aug 17, 2017, 10:35:09 AM8/17/17
to weewx-user
On Wednesday, August 16, 2017 at 2:31:59 PM UTC-7, Christian Peters wrote:
Here is my quick and dirty grafana weewx test page.
Really nice....and easy to push custom data into InfluxDB (e.g. by telegraf and exec input plugin).
oooooohhhhhhhh - nice........
I'd be very interested in how to set up something like that if you have time to document stuff and/or stick some repo(s) up on github or the like....
Christian Peters
Aug 17, 2017, 1:05:47 PM8/17/17
to weewx-user
Hi,
a good starting point:
http://foxutech.com/setup-influxdb-grafana-and-telegraf-on-ubuntu/
or
https://www.circuits.dk/install-grafana-influxdb-raspberry/
Install InfluxDB on your linux computer,
https://portal.influxdata.com/downloads
Usually nothing to configure (check install with 'influx', see links.
Install Garfana (see links or website)
https://grafana.com/grafana/download
install weewx-influx, my minimal configuration in weewx.conf (you have to modify to your needs):
[[Influx]]
host = localhost
database = weewx_metrics
port = 8086
unit_system = METRICWX
You don't have to create a database in InfluxDB, the plugin will do it for you, I chose 'weewx_metrics'. You don't need a password so it's problematic to share the dashboard in www?
In Grafana you have to add the Influxdb as data source:
1.) The top left Menu (icon of Spiral)
2.) Data Sources
3.) + Add data source
4.) Fill out:
a.) Name: InfluxDB
b.) Type: InfluxDB
c.) (HTTP Settings) Url: http://10.0.0.20:8086 (or in my case http://localhost:8086)
d.) (InfluxDB Settings) Database: weewx_metrics
5.) Click “Save & Test” — it will save and work
In Grafana you now can design your own graphs as I did, I installed the D3 Gauge plugin for the radial gauges.
I append a screenshot from the temp graph to have an idea.
You have to play with it a littel bit, I started with and additional installation of telegraf and loaded a ready-to-go dashboard to monitor my linux server:
https://grafana.com/dashboards/914
Have fun!
Sorry, very rough informations. If I can help I will try....but I'm not a specialist....
Regards,
Christian
Btw.: There is an alpha testing on the way for using MYSQL as data input in Grafana...so maybe there wile be a possibility to get the data direct from the weewx mysql database in the future (without InfuxDB)!?
I can share my testing panel as starting point....

Ralf Buck
Jan 24, 2018, 11:48:44 AM1/24/18
to weewx-user
how can i install weewx-influx?
i read: wee_extension --install weewx-influx.tgz
but where can i find the tgz file?
regard
Am Mittwoch, 16. August 2017 23:31:59 UTC+2 schrieb Christian Peters:
vince
Jan 24, 2018, 12:21:39 PM1/24/18
to weewx-user
On Wednesday, January 24, 2018 at 8:48:44 AM UTC-8, Ralf Buck wrote:
how can i install weewx-influx?i read: wee_extension --install weewx-influx.tgzbut where can i find the tgz file?
try a google search for "weewx-influx" and open the first link....
Ralf Buck
Jan 24, 2018, 12:26:32 PM1/24/18
to weewx-user
thx
i know this page, there i found the manual:
Installation

1) run the installer:

wee_extension --install weewx-influx.tgz
but, there is no weewx-influx.tgz file
i can only download the zip from github.
i had try this, but seems thats wrong.
wee_extension --install weewx-influx-master.zip
Request to install 'weewx-influx-master.zip'
Extracting from zip archive weewx-influx-master.zip
Saving installer file to /usr/share/weewx/user/installer/influx
Saved configuration dictionary. Backup copy at /etc/weewx/weewx.conf.20180124181938
Finished installing extension 'weewx-influx-master.zip'
root@orangepiplus:/home/ralf/weewx-influx-master# cd /usr/share/weewx/user/installer/influx
root@orangepiplus:/usr/share/weewx/user/installer/influx# ls
install.py
root@orangepiplus:/usr/share/weewx/user/installer/influx# sudo chmod +x .
root@orangepiplus:/usr/share/weewx/user/installer/influx# ls
install.py
root@orangepiplus:/usr/share/weewx/user/installer/influx# ./install.py
from: can't read /var/mail/setup
./install.py: line 7: syntax error near unexpected token(' ./install.py: line 7:def loader():'
root@orangepiplus:/usr/share/weewx/user/installer/influx#
regardAm Mittwoch, 16. August 2017 23:31:59 UTC+2 schrieb Christian Peters:
Ralf Buck
Jan 24, 2018, 1:13:34 PM1/24/18
to weewx-user
runs now,
wee_extension --install weewx-influx-master.zip
was correct
another question, is it possible to convert
my sqlite database to influxdb?
regard
Am Mittwoch, 16. August 2017 23:31:59 UTC+2 schrieb Christian Peters:
Ralf Buck
Jan 24, 2018, 3:04:31 PM1/24/18
to weewx-user
and another question
seems that the extension ignore my correction values
[StdCalibrate]
[[Corrections]]
# For each type, an arbitrary calibration expression can be given.
# It should be in the units defined in the StdConvert section.
# Example:
foo = foo + 0.2
rain = rain * 0.2374
rainRate = rainRate * 0.2374
and, how can i change from _cm to _mm e.g. hourRain_cm to hourRain_mm ?
regard

Thomas Keffer
Jan 24, 2018, 3:53:24 PM1/24/18
to weewx-user
The InfluxDB extension is not a substitute database for sqlite or MySQL. Instead, it is an uploader, much like the Weather Underground uploader. It takes the data and posts it to your InfluxDB database, using the InfluxDB http "line protocol."
Why do you say that the extension is ignoring your correction values?
-tk
--
You received this message because you are subscribed to the Google Groups "weewx-user" group.
To unsubscribe from this group and stop receiving emails from it, send an email to weewx-user+unsubscribe@googlegroups.com.
For more options, visit https://groups.google.com/d/optout.
Ralf Buck
Jan 25, 2018, 7:27:31 AM1/25/18
to weewx-user
my error.
i had used in my conf
unit_system = METRIC
this is wrong
if i use
unit_system = METRICWX
the upload script use my (right) values incl. correction
Am Mittwoch, 16. August 2017 23:31:59 UTC+2 schrieb Christian Peters:

Robert Lagus
Oct 16, 2018, 5:41:39 AM10/16/18
to weewx-user
Hello Christian,
Do you happen to have published this particular dashboard ("weewx-grafana.png" based on Weewx Data in InfluxDB)?
I can see further down you linked to a dash for system performance overview, not weather data?
The above dashboard looks fantastic and I would like to piggyback on your work use it as well if it's ok.
Thanks!
//Robert
//Robert
Message has been deleted
Message has been deleted
Message has been deleted


Xant
Dec 2, 2019, 4:28:36 PM12/2/19
to weewx-user
My system is Rpi (WeeWX) + Qnap (server).
I successfully installed InfluxDB and Grafana into Qnap, but upon starting WeeWX and checking Syslog, I get errors:
root@raspberrypi:~# tail -f /var/log/syslograspberrypi weewx: restx: Influx: tags Noneraspberrypi weewx: restx: Influx: binding is archiveraspberrypi weewx: restx: Influx: create database failed: <urlopen error [Errno -2] Name or service not known>raspberrypi weewx: restx: Influx: Data will be uploaded to http://INSERT_HOST_HERE:8086raspberrypi weewx: engine: Starting up weewx version 3.9.2
I followed this link instructions, which has '8086' defined as Influx port: https://qiot.qnap.com/blog/2018/12/12/install-influxdb-grafana-qnap-nas/
Also, followed Matthew Wall instructions: https://github.com/matthewwall/weewx-influx
Qnap IP is 192.168.1.107.
Thus, weewx.conf as:
[StdRESTful]...[[Influx]]database = WeeWXhost = 192.168.1.107port = 8086
Can anyone spot something?
Thanks, Xant
Xant
Dec 3, 2019, 1:26:31 PM12/3/19
to weewx-user
Please disregard posting above, as InfluxDB and Grafana now working on Qnap.
Now, trying to figure-out how Grafana works... will keep posted upon progress.
X
Xant
Dec 3, 2019, 4:00:33 PM12/3/19
to weewx-user
After some research, got InfluxDB and Grafana working on Qnap, and now my 1st Graph. So, I can certify that you can use your NAS, or other remote system, for WeeWX purposes, without having to install all packages on Rpi.
Most things are straight forward, but most struggle to start with Grafana as most Tutorials refers to older versions.
The following are some steps, which may reproduce steps posted above, but as a summary:
1) Install InfluxDB and Grafana in Qnap
Per following instructions, install InfluxDB and Grafana through Qnap ConstainerStation, with the exception that don't need to create Database (weewx-influxdb driver would do it), neither deal with QIoT Suite Lite (skip those steps):
Note that will create Container port-forwarding Port# 8086, and Grafana Port# 3000
Follow instructions for Grafana, but don't establish Database or create Dashboard yet.
2) Install weewx-influxdb driver - thanks to Matthew Wall
Edit weewx.conf accordingly:
[[Influx]]
database = [database_name]
host = [host_IP]
port = [port#]
database = [database_name]
host = [host_IP]
port = [port#]
Just the minimum settings above is sufficient, as the driver will create the Influx Database and upload all measured data.
Restart weewx, and verify syslog that it is uploading to Influx database.
3) Back to Grafana
Start Grafana: http://[host_IP]:3000
Establish Database (per previous instructions) and Create Dashboard.
For starters on Grafana, to note that most Tutorials are outdated, thus the following:
- Click the big "+" (plus sign) on the top-Left and select Dashboard
- Click "Choose Visualization" and select "Graph"
- On Graph panel, click Queries icon on Left menu (icon looks like "hamburger")
- On Query drop-down menu, select your Database (InfluxDB on my case)
- On "FROM" ... 'select measurement' drop-down menu, select 'record'
- On "SELECT" ... 'field(value)', click on VALUE (not field) and select your WX variable
- Upon selected WX variable, plot will show immediately
Now, tweak around and build own Dashboard.
X
Xant
Dec 3, 2019, 10:22:55 PM12/3/19
to weewx-user
(update)
At this point, I pretty much reproduced original Christian Dashboard. Once you get the hand-of-it, things are much quicker to setup sensors.
Dashboard at this point is "static", and not real-time updated and graphical response. Searching for MQTT solutions, or similar. InfluxDB has a plugin called Telegraf, and Qnap also has its own IoT package. Will investigate.
Important to note that Grafana may develop source link direct to SQlite DB (although, this promise is more than 2yo). If so, would be no need for InfluxDB and direct reading direct WeeWX DB.
X
Message has been deleted
Xant
Dec 4, 2019, 8:27:53 PM12/4/19
to weewx-user
This posting is a "review" and sharing feedback regarding the Grafana experience. Not intended to be an "in-depth" discussion, neither great debate, just personal "pros and cons" for WeeWX.
B) Cons of Grafana
For a start, to note that Grafana vs Highcharts might "bananas vs apples".... Grafana intended to IoT monitoring, while Highcharts for generic plotting.
A) Pros of Grafana
- WeeWX/InfluxDB driver by Matthew Wall (thanks!); ALL variables submitted with minimum config
- enjoyed the experience and easy to play the Graphs (once you figured-out; check my previous posting on this regard); but it does looks great
- do your own WX Dashboard... to your liking (or almost)
- does not read directly from SQlite DB, but requires InfluxDB; to be impartial, not difficult to install InfluxDB, but sure an extra step and another DB; there are posting mentioning Grafana development for direct SQlite DB... but that has been more than 2yo, and not sure if will ever come out
- can not embed Grafana dashboard to webpage (no "iframe")... that's a dagger if planning to embed to own WX webpage (unfortunately, it was one of my latest findings...)
- no spline line option in graph (!), and no other smothering for plot... graphs looks "stiff"
- Highcharts offers more options, and might be more up-to-date regarding appearance and flexibility (that to say, Pat took the right path for Bskin)
- besides research, could not make Node-Red or Telegraf (Influx plugin) to properly MQTT; thus the dashboard is mostly static, with no real uptime (I gave up)
C) Extra comments
My system is Rpi3 (for WeeWX) + QNAP (for web hosting). Thus, the "natural" path was to install InfluxDB/Grafana in the NAS system, which has more CPU power, letting Rpi3 just for WeeWX load. What I learned, is that QNAP does not directly support InfluxDB/Grafana, but through its own Container system/docker (ie, a virtual inner platform). This was easy and works fine for basic assessment. But as you dig further, it is much inconvenient.
Would I do it again (QNAP that is)?
Maybe not, but InfluxDB/Grafana on Rpi; would save much troubles on the way.
To note, Grafana offers free hosting on their cloud service. I have not tried, but interesting to consider.
Bottom line, if interesting to learn further on IoT and monitoring... go ahead. Otherwise, till direct SQlite interface, dashboard website embed, and MQTT, may not be for general WX.
X

Greg Troxel
Dec 4, 2019, 9:00:08 PM12/4/19
to Xant, weewx-user
Xant <armando...@gmail.com> writes:
> For a start, to note that Grafana vs Highcharts might "bananas vs
> apples".... Grafana intended to IoT monitoring, while Highcharts for
> generic plotting.
Another significant difference is that Grafana is Open Source and
> For a start, to note that Grafana vs Highcharts might "bananas vs
> apples".... Grafana intended to IoT monitoring, while Highcharts for
> generic plotting.
Highcharts is proprietary.
https://shop.highsoft.com/faq
Xant
Dec 4, 2019, 9:18:50 PM12/4/19
to weewx-user
A most important point Greg!
Specially nowadays, when Open Source seems "old school", and glad to those that still carries and supports this flag. Hope for continuing dev, expanding adoption and application.
Besides proprietary, also thanks Highcharts for keeping free for Non-commercial use approach.
X
Xant
Dec 14, 2019, 10:51:49 PM12/14/19
to weewx-user
(update)
It seems that Grafana has actually been ported to Embedded Website applications, and therefore, and interesting option to consider to WX purposes.
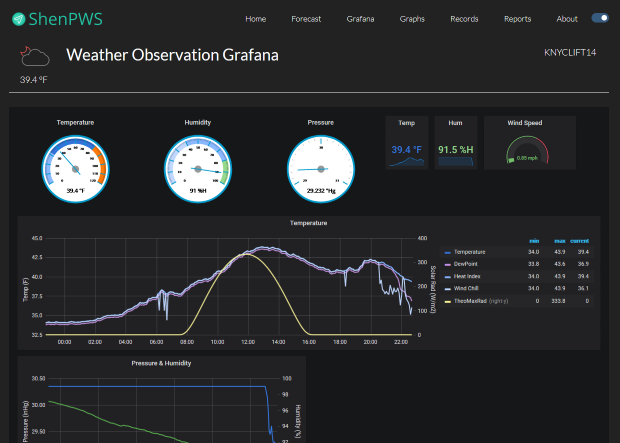
1) AnonymousEdit "defaults.ini" to allow anonymous access, no password and role as viewer.2) URLiframe can be setup to share a single panel (graph) or the entire dashboard.Many options can be insert in menu, including timeframe.Add '&kiosk' at the end of URL to remove buttons and menus.
Example:
<iframe src="http://192.168.1.107:3000/d/FluNFv-Wk/weewx?from=now-24h&to=now&kiosk" height="820" width="100%" frameborder="0" scrolling="no"></iframe>
Snapshot:
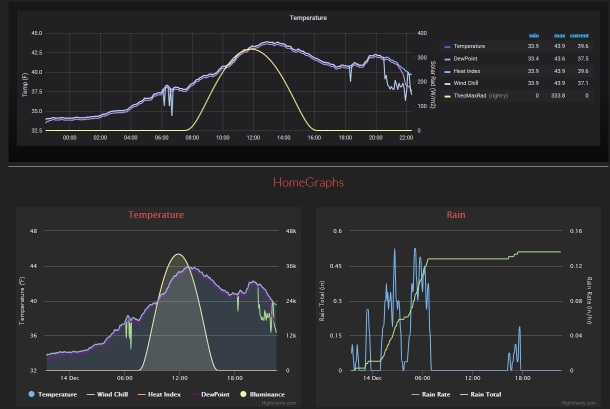
Grafana panel Temp Chart inserted in Belchertown front page, on-top of Highcharts.
Grafana entire dashboard in new page at Belchertown skin.
Once again, thanks Matthew Wall for weewx-influxdb extension (https://github.com/matthewwall/weewx-influx).
X
Xant
Dec 16, 2019, 8:37:53 PM12/16/19
to weewx-user
Forget about porting InfluxDB & Grafana in a NAS, if you have WeeWX in RPi.... too much trouble to setup in a "Container".
I previously mentioned how to port InfluxDB & Grafana in QNAP... but now installed and moved to RPi (database restarting)... and NOT without difficulties. To note, usual or outdated directions does NOT work, so follow the following;
RPi - Raspbian Buster
A) InfluxDB
B) Grafana
Extra note: Anonymous access for Website Embed Grafana panel or dashboard
% apt isntall influxdb
% systemctl unmask influxdb
% systemctl enable influxdb
% systemctl enable influxdb
% influx
Config file:
/etc/influxdb/influxdb.conf
Meta database file:
/var/lib/influxdb/meta/meta.db
http://[localhost/IP]:8086
https://pimylifeup.com/raspberry-pi-influxdb/
https://docs.influxdata.com/influxdb/v1.7/administration/config/
B) Grafana
% wget https://dl.grafana.com/oss/release/grafana_6.5.2_armhf.deb
% dpkg -i grafana_6.5.2_armhf.deb
Install msg:
### NOT starting on installation, please execute the following statements to configure grafana to start automatically using systemd
% sudo /bin/systemctl daemon-reload
% sudo /bin/systemctl enable grafana-server
### You can start grafana-server by executing
% sudo /bin/systemctl start grafana-server
Package notes:
Installs binary to /usr/sbin/grafana-server
Installs Init.d script to /etc/init.d/grafana-server
Creates default file (environment vars) to /etc/default/grafana-server
Installs configuration file to /etc/grafana/grafana.ini
Installs systemd service (if systemd is available) name grafana-server.service
The default configuration sets the log file at /var/log/grafana/grafana.log
The default configuration specifies an sqlite3 db at /var/lib/grafana/grafana.db
Installs HTML/JS/CSS and other Grafana files at /usr/share/grafana
http://[localhost/IP]:3000
https://grafana.com/grafana/download?platform=arm
https://grafana.com/docs/grafana/latest/installation/debian/#package-details
1) Anonymous access
Edit
"defaults.ini" to allow anonymous access, no password and role as
viewer (in RPi, remove ';' from Config file to be effective!).
[auth.anonymous]
enabled = true
org_name = ['Main Org.' or other]
org_role = Viewer
[auth.basic]
...
allow_embedding = true
https://stackoverflow.com/questions/33111835/how-to-set-up-grafana-so-that-no-password-is-necessary-to-view-dashboards
https://grafana.com/docs/grafana/latest/installation/configuration/

Tryphon Cosinus
May 31, 2020, 1:06:13 PM5/31/20
to weewx-user
Hello,
@Xant
I did not understand the role of the PI in your set up. Weewx can be installed straight in QTS via SSH. At least it works with Python 2.7. My weather station (Acurite) is connected to USB (QNAP NAS). A long time ago, I made a tuto on this installation (https://www.forum-nas.fr/viewtopic.php?f=55&t=3112). In french but can be automatically translated.
Xant
Jun 2, 2020, 8:55:57 PM6/2/20
to weewx-user
Reply all
Reply to author
Forward
0 new messages