Full day highcharts question

Didier Decoodt

Pat
Didier Decoodt
--
You received this message because you are subscribed to the Google Groups "weewx-user" group.
To unsubscribe from this group and stop receiving emails from it, send an email to weewx-user+...@googlegroups.com.
To view this discussion on the web visit https://groups.google.com/d/msgid/weewx-user/0bd9ab2a-3b47-433b-847c-8705840614a4o%40googlegroups.com.
Pat
On Sunday, June 14, 2020 at 10:38:08 AM UTC-4, Didier Decoodt wrote:
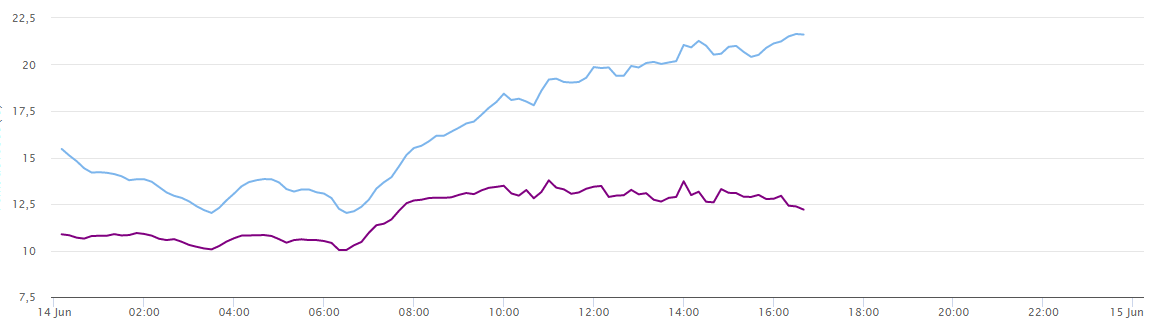
Yes, but How to have 24 hours duration for xAxis?
Le dim. 14 juin 2020 à 16:31, Pat <p...@obrienphoto.net> a écrit :
Right now the time_length = today will only show you the values that have happened since midnight.--
On Sunday, June 14, 2020 at 4:22:04 AM UTC-4, Didier Decoodt wrote:HiFor the current day graph, I would like to have the xAxis from the beginning of the day to the end of the day (midnight).When I use time_length = today, I have from the beginning of the dya (ok) to the current hourMy question is: which parameter I have to write in my graphs.conf?Many thanks
You received this message because you are subscribed to the Google Groups "weewx-user" group.
To unsubscribe from this group and stop receiving emails from it, send an email to weewx...@googlegroups.com.
Didier Decoodt
To unsubscribe from this group and stop receiving emails from it, send an email to weewx-user+...@googlegroups.com.
To view this discussion on the web visit https://groups.google.com/d/msgid/weewx-user/d280aebe-b614-4139-ac11-07c5541d7466o%40googlegroups.com.
Pat
Didier Decoodt
To unsubscribe from this group and stop receiving emails from it, send an email to weewx-user+...@googlegroups.com.
To view this discussion on the web visit https://groups.google.com/d/msgid/weewx-user/5e27f508-41dd-4620-add7-58f667c925cbo%40googlegroups.com.

Manfred Maier
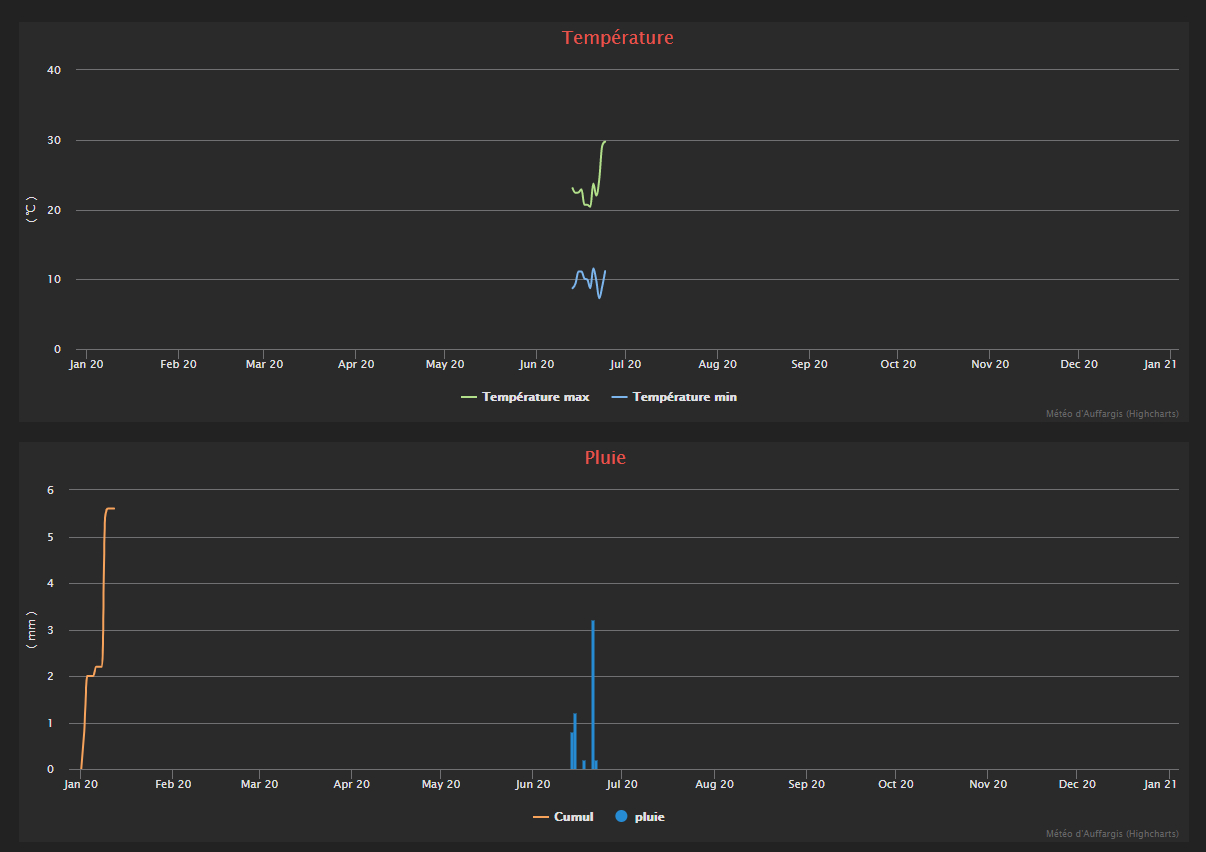
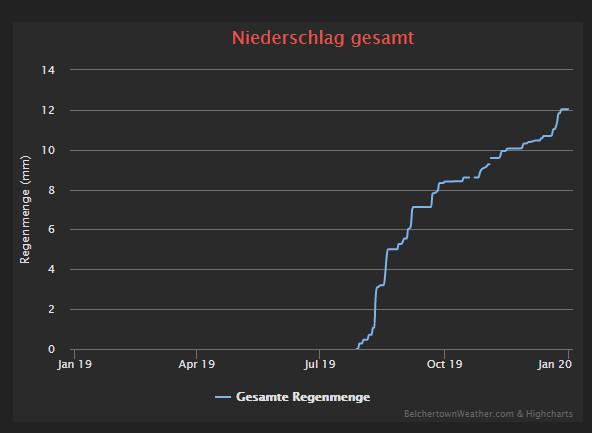
This new behavior (ie. showing the entire year / month on the x-axis) has been the main motivation for me for switching to weewx 4.0.
Pat O'Brien
--
You received this message because you are subscribed to a topic in the Google Groups "weewx-user" group.
To unsubscribe from this topic, visit https://groups.google.com/d/topic/weewx-user/UWSnqt7tY3Q/unsubscribe.
To unsubscribe from this group and all its topics, send an email to weewx-user+...@googlegroups.com.
To view this discussion on the web visit https://groups.google.com/d/msgid/weewx-user/95b20ca2-ed9a-430d-8df7-e8327d8ccbaeo%40googlegroups.com.
Manfred Maier
Pat
Pat
archive.getSqlVectors(TimeSpan(1592107200, 1592193600), outTemp, None, None)
archive.getSqlVectors(TimeSpan(1577854800, 1609477200), outTemp, max, 86400)

gjr80
Manfred Maier

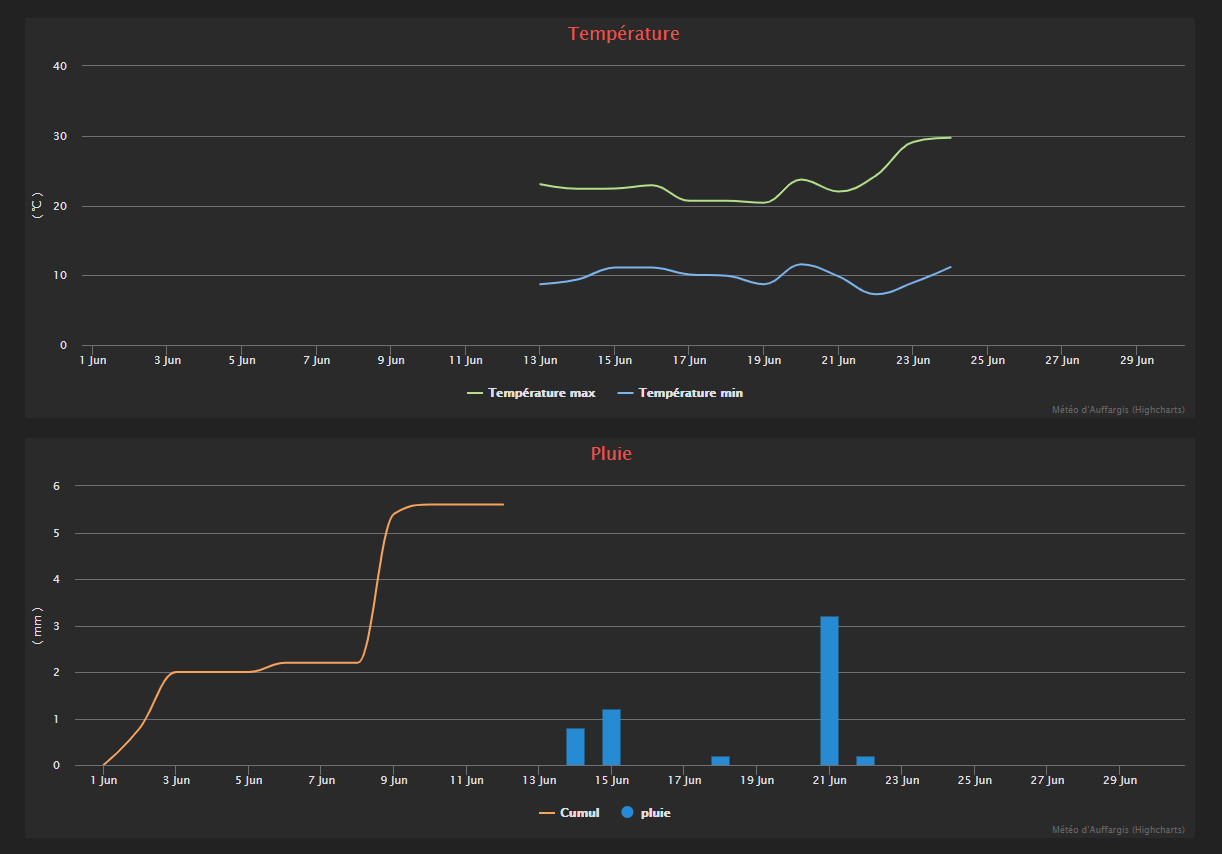
The trick is quite simple: I just had to define an aggregation for the daily charts. I.e. adding the following two lines to the graphs.conf:
aggregate_type = max
aggregate_interval = 300
didier....@gmail.com
Pat
didier....@gmail.com
Pat
Pat
Didier Decoodt

--
You received this message because you are subscribed to the Google Groups "weewx-user" group.
To unsubscribe from this group and stop receiving emails from it, send an email to weewx-user+...@googlegroups.com.
To view this discussion on the web visit https://groups.google.com/d/msgid/weewx-user/35aa4d91-2dd6-4fc5-882d-78ddfd99c18co%40googlegroups.com.
Pat
To unsubscribe from this group and stop receiving emails from it, send an email to weewx...@googlegroups.com.
Didier Decoodt
To unsubscribe from this group and stop receiving emails from it, send an email to weewx-user+...@googlegroups.com.
To view this discussion on the web visit https://groups.google.com/d/msgid/weewx-user/d738ffbd-0729-42a0-8b0e-15aa37381d95o%40googlegroups.com.
Didier Decoodt
Pat
On Monday, June 22, 2020 at 7:05:00 PM UTC-4, Didier Decoodt wrote:
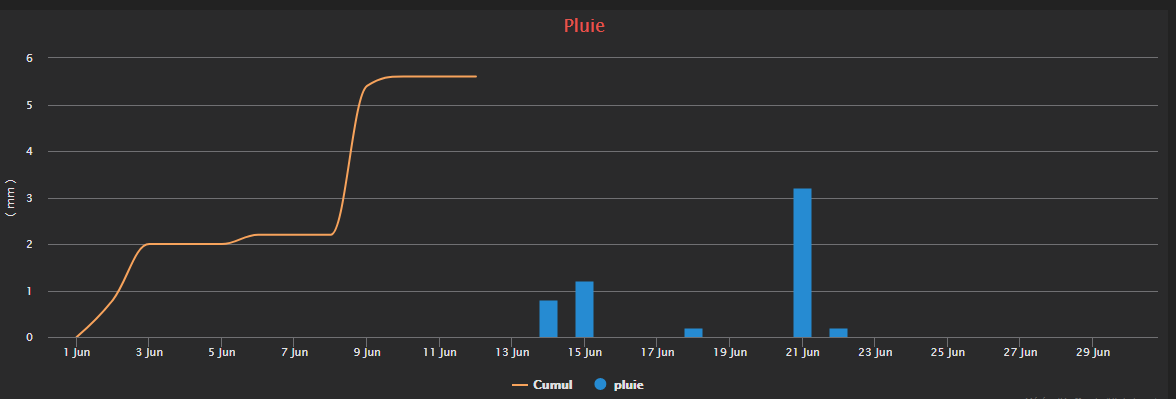
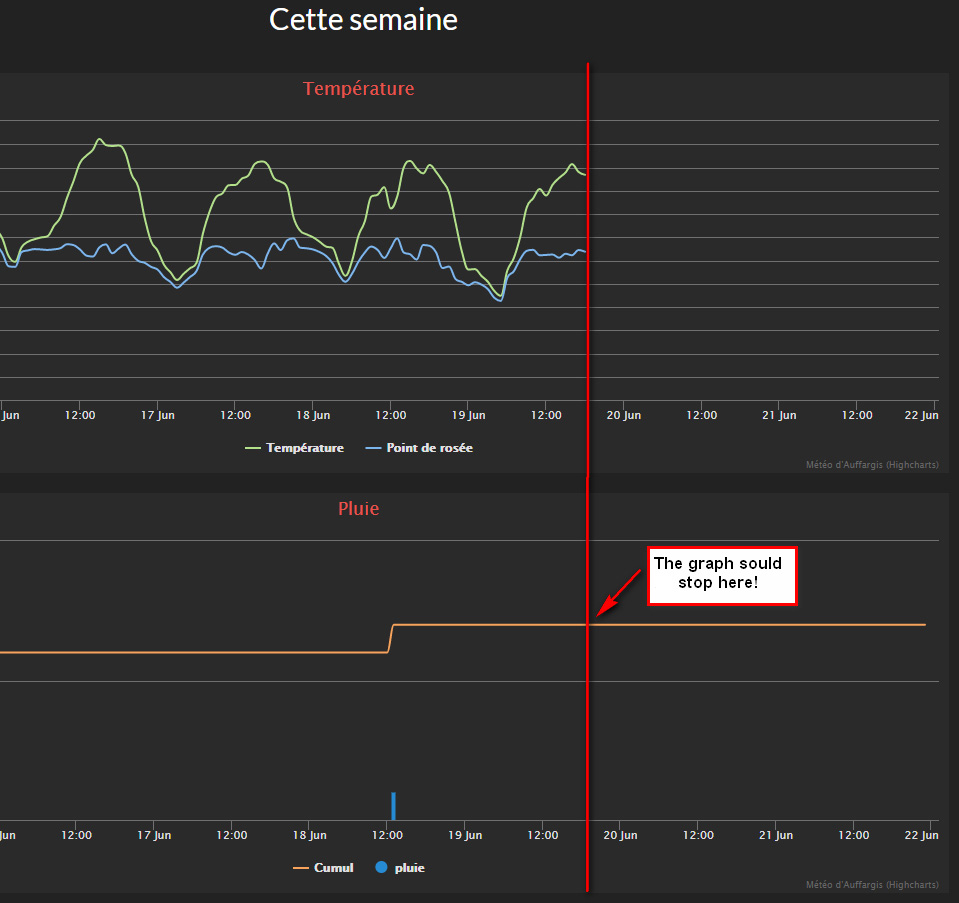
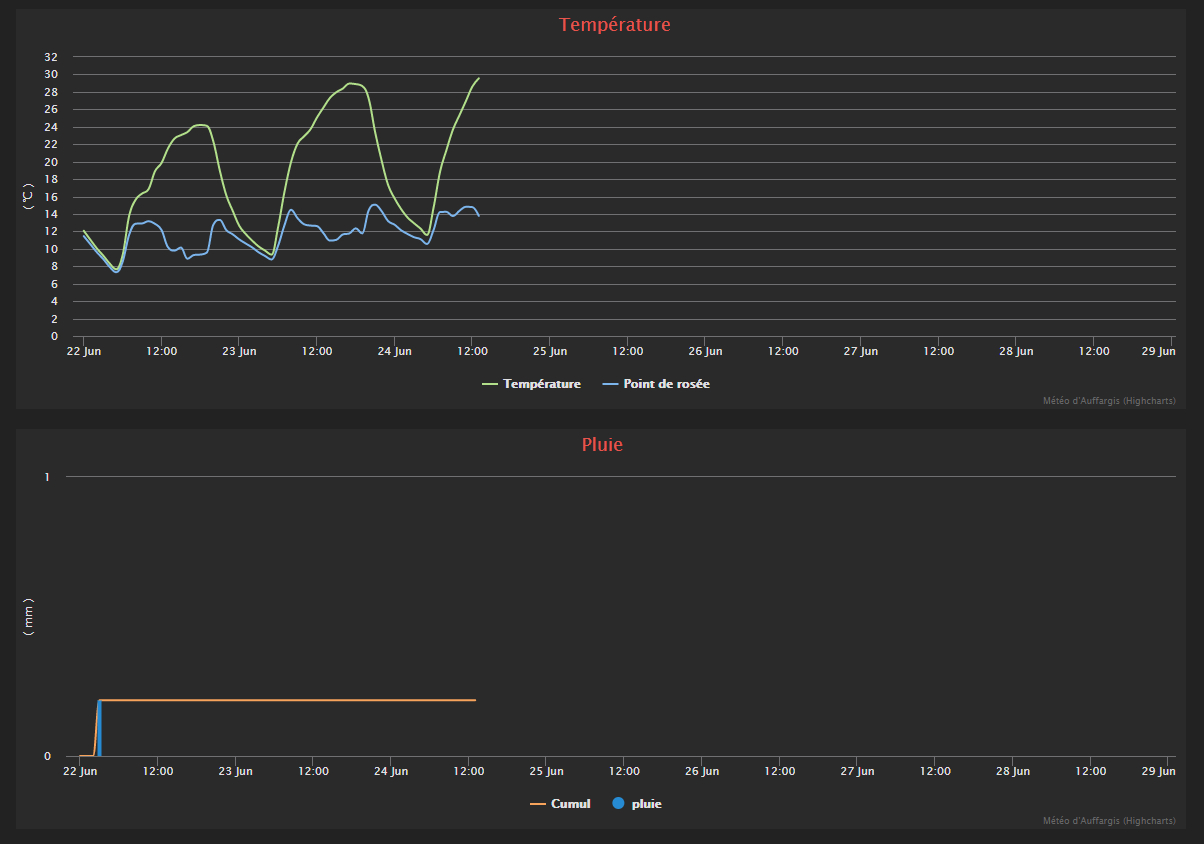
OupssIt seems to be correct but the aggregate_interval is not correct, every 5 mn instead of 1 day for monthly graphic...aggregate_type=none is not appropriate...(with aggregate_type=last the curve continue after "now")I think the problem is linked with rainTotal variable,
Thanks for this documentation
To view this discussion on the web visit https://groups.google.com/d/msgid/weewx-user/d738ffbd-0729-42a0-8b0e-15aa37381d95o%40googlegroups.com.
Didier Decoodt
gapsize = 86400000 # 1 day in milliseconds
To unsubscribe from this group and stop receiving emails from it, send an email to weewx-user+...@googlegroups.com.
To view this discussion on the web visit https://groups.google.com/d/msgid/weewx-user/4a5a30f5-2eef-40ba-976d-f80e8ff11893o%40googlegroups.com.
Pat
To view this discussion on the web visit https://groups.google.com/d/msgid/weewx-user/4a5a30f5-2eef-40ba-976d-f80e8ff11893o%40googlegroups.com.
Didier Decoodt
To unsubscribe from this group and stop receiving emails from it, send an email to weewx-user+...@googlegroups.com.
To view this discussion on the web visit https://groups.google.com/d/msgid/weewx-user/e1f5cc02-3585-4aa7-af87-fc37df0e5ba5o%40googlegroups.com.
Pat
To view this discussion on the web visit https://groups.google.com/d/msgid/weewx-user/e1f5cc02-3585-4aa7-af87-fc37df0e5ba5o%40googlegroups.com.
Didier Decoodt
To unsubscribe from this group and stop receiving emails from it, send an email to weewx-user+...@googlegroups.com.
To view this discussion on the web visit https://groups.google.com/d/msgid/weewx-user/fc7ec2c8-8d1c-415c-be60-62dda8f956aeo%40googlegroups.com.
Manfred Maier
Didier Decoodt
To view this discussion on the web visit https://groups.google.com/d/msgid/weewx-user/690bccbc-85af-4d11-bcac-f4c2d23cb975n%40googlegroups.com.
Manfred Maier

Didier Decoodt
To view this discussion on the web visit https://groups.google.com/d/msgid/weewx-user/dbd12f3f-6fa0-426d-8e5a-2facf9152a3dn%40googlegroups.com.
Pat
Didier Decoodt
Please paste your full graph that's broken so I can take a look at it
--
You received this message because you are subscribed to the Google Groups "weewx-user" group.
To unsubscribe from this group and stop receiving emails from it, send an email to weewx-user+...@googlegroups.com.
To view this discussion on the web visit https://groups.google.com/d/msgid/weewx-user/2669f288-4099-45af-88e7-5382397bf5b9o%40googlegroups.com.
Manfred Maier
Pat
Manfred Maier
Pat
Manfred Maier
Didier Decoodt
--
You received this message because you are subscribed to the Google Groups "weewx-user" group.
To unsubscribe from this group and stop receiving emails from it, send an email to weewx-user+...@googlegroups.com.
To view this discussion on the web visit https://groups.google.com/d/msgid/weewx-user/295f9456-430d-44fb-9c4e-9b61640794e0n%40googlegroups.com.
Manfred Maier
Hi Pat,
Jun 24 22:20:20 raspberrypi weewx[6177] ERROR weewx.cheetahgenerator: Generate failed with exception '<class 'NameMapper.NotFound'>'
Jun 24 22:20:20 raspberrypi weewx[6177] ERROR weewx.cheetahgenerator: **** Ignoring template /etc/weewx/skins/Belchertown/js/belchertown.js.tmpl
Jun 24 22:20:20 raspberrypi weewx[6177] ERROR weewx.cheetahgenerator: **** Reason: cannot find 'forecast_provider'
Jun 24 22:20:20 raspberrypi weewx[6177] ERROR weewx.cheetahgenerator: **** Traceback (most recent call last):
Jun 24 22:20:20 raspberrypi weewx[6177] ERROR weewx.cheetahgenerator: **** File "/usr/share/weewx/weewx/cheetahgenerator.py", line 322, in generate
Jun 24 22:20:20 raspberrypi weewx[6177] ERROR weewx.cheetahgenerator: **** unicode_string = compiled_template.respond()
Jun 24 22:20:20 raspberrypi weewx[6177] ERROR weewx.cheetahgenerator: **** File "_etc_weewx_skins_Belchertown_js_belchertown_js_tmpl.py", line 1154, in respond
Jun 24 22:20:20 raspberrypi weewx[6177] ERROR weewx.cheetahgenerator: **** NameMapper.NotFound: cannot find 'forecast_provider'
Pat O'Brien
You received this message because you are subscribed to a topic in the Google Groups "weewx-user" group.
To unsubscribe from this topic, visit https://groups.google.com/d/topic/weewx-user/UWSnqt7tY3Q/unsubscribe.
To unsubscribe from this group and all its topics, send an email to weewx-user+...@googlegroups.com.
To view this discussion on the web visit https://groups.google.com/d/msgid/weewx-user/4e605379-67f9-4db4-b1a9-07b752dcbcebn%40googlegroups.com.
Manfred Maier
# Forecast defaults
forecast_enabled = 1
forecast_provider = "darksky"
forecast_api_id = "b6b2add3..."
forecast_api_secret = "b6b2add3..."
forecast_units = "ca"
forecast_lang = "de"
forecast_stale = 3540
forecast_alert_enabled = 1
forecast_alert_limit = 1
forecast_show_daily_forecast_link = 0
forecast_daily_forecast_link = ""
Pat O'Brien
To view this discussion on the web visit https://groups.google.com/d/msgid/weewx-user/aa56d448-ba0a-4d31-a737-ba2eb27c191fn%40googlegroups.com.
Manfred Maier
Pat O'Brien
To view this discussion on the web visit https://groups.google.com/d/msgid/weewx-user/712411b5-3388-4713-b710-adf4523f36f6n%40googlegroups.com.
Manfred Maier
* Putting back the quotation marks fixed this issue

Christian Gruber

James Taylor
# These are fallback options that charts will use if an option is not defined.
aggregate_type = None
time_length = 90000 # Last 25 hours
type = line
colors = "#7cb5ec, #b2df8a, #f7a35c, #8c6bb1, #dd3497, #e4d354, #268bd2, #f45b5b, #6a3d9a, #33a02c"
tooltip_date_format = "LLL"
[day]
# Chart Timespan Defaults
title = "Today since Midnight"
show_button = true
button_text = "Day"
time_length = today
tooltip_date_format = "LLL"
aggregate_type = max
aggregate_interval = 300
[[chart1]]
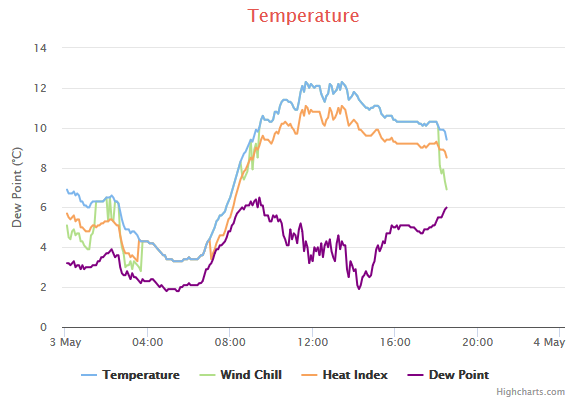
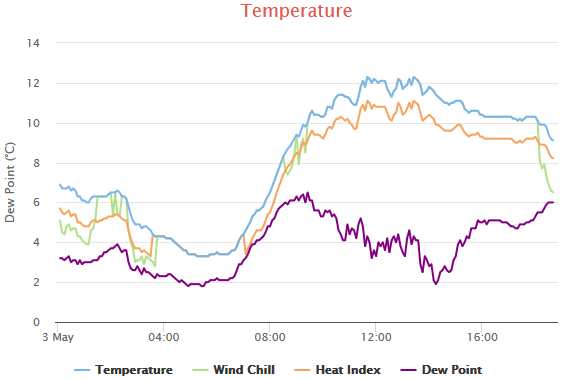
title = Temperature
start_at_midnight = true
[[[outTemp]]]
zIndex = 1
name = Temperature
[[[windchill]]]
[[[heatindex]]]
color = "#f7a35c"
[[[dewpoint]]]
color = purple
